1 SBS-MODIFIED BITUMEN MEMBRANES ENVIRONMENTAL PRODUCT DECLARATION Specialized in the development and manufacturing of insulation, vegetated and soundproofing products and solutions for the roofing, building envelope and civil engineering fields worldwide, SOPREMA is pleased to present the environmental product declaration (EPD) of its SBS-modified bitumen membranes with a torch-applied cap sheet and four base sheet options. This EPD presents the results of the life cycle assessment (LCA) of the SBS-modified bitumen membranes with a torch-applied cap sheet and four base sheet options, encompassing the raw materials supply, manufacturing, transport, installation, use, and end-of-life stages (i.e., cradle to grave). The EPD was prepared by CT Consultant according to the prescribed product category rules (PCRs), ISO 14025:2006 and ISO 21930:2017, and verified by Marie Bellemare Consulting. For more information about SOPREMA, visit https://www.soprema.ca/en/ TORCH-APPLIED CAP SHEET
2 EPD – SBS-MODIFIED BITUMEN MEMBRANES – TORCH-APPLIED CAP SHEET 1| GENERAL INFORMATION Program operator ASTM International 100 Barr Harbor Drive West Conshohocken, PA 19428 United States of America (USA) www.astm.org General program instructions ASTM International. General program instructions for environmental product declarations. https://www.astm.org/products-services/certification/environmental-product-declarations.html EPD recipient organization, ownership and liability SOPREMA 1688 Jean-Berchmans-Michaud Street Drummondville, Quebec Canada J2C8E9 www.soprema.ca/en EPD registration number EPD 968 Product SBS-modified bitumen membranes – Torch-applied cap sheet and four base sheet options Functional unit 100 m2 [1076.4 ft2] of installed SBS-modified bitumen membrane (base and cap sheets) including resurfacing and replacement for the 75-year estimated building service life. Reference product category rules (PCR) PCR Part A: UL Environment Building Related Products and Services. Life cycle assessment calculation rules and report requirements, v4.0. March 2022. Standard UL 10010. [1] PCR Part B: UL Environment Building Related Products and Services. Asphalt shingles, built-up asphalt membrane roofing and modified bituminous membrane roofing EPD requirements, v1.2. May 2021. Standard UL 10010-11. [2] Product reference service life 25 years Market of applicability North America Date of issue May 2, 2025 Period of validity May 2025 – May 2030 EPD type Product-specific Dataset variability Not applicable EPD scope Cradle to grave Reference period 2022 LCA software openLCA v2.02 [3] LCI database Ecoinvent v3.9.1, Cut-off by classification [4] LCIA method IPCC 2013 [5], TRACI 2.1 [6] and CML-baseline 4.7 [7] The sub-category PCR review was conducted by: Thomas Gloria, PhD Industrial Ecology 35 Bracebridge Road, Newton United States of America (USA) (617) 533-4929 t.gloria@industrial-ecology.com The life cycle assessment was independently verified in accordance with ISO 14044:2006 and the reference PCRs. This declaration was independently verified in accordance with ISO 14025:2006. The UL Environment “Part A: Life cycle assessment calculation rules and report requirements”, v4.0 (March 2022), in conformance with ISO 21930:2017, serves as the core PCR, with additional considerations from the USGBC/UL Environment Part A Enhancement (2017). ☐ INTERNAL ☒ EXTERNAL Marie Bellemare Consulting This life cycle assessment was conducted in accordance with ISO 14044:2006, ISO 14025:2006 and the reference PCR by: CT Consultant LIMITATIONS: EPDs from different programs may not be comparable (ISO 14025:2006 [8]). Comparison of the environmental performance using EPD information shall consider all relevant information modules over the full life cycle of the products within the building. The PCRs allows EPD comparability only when the same functional requirements between products are ensured and the requirements of ISO 21930:2017 [9] Section 5.5 are met. It should be noted that different LCA software and background LCI datasets may lead to different results for upstream or downstream of the life cycle stages declared.
3 EPD – SBS-MODIFIED BITUMEN MEMBRANES – TORCH-APPLIED CAP SHEET 2| PRESENTATION OF SOPREMA 2.1. Description of the company Founded in 1908 in Strasbourg, France, SOPREMA is a manufacturing company established in over 90 countries. SOPREMA specializes in the manufacturing of waterproofing, insulating, greening and soundproofing products for the building and civil engineering sectors. With the environment at the heart of its corporate values, SOPREMA innovates in the field of sustainable construction materials through its 17 research and development centres around the world. SOPREMA offers a growing range of products for the sustainable building sector, positioning the company as a leader in the field. 2.2. Manufacturing sites SOPREMA’s manufacturing plants dedicated to the torch-applied SBS-modified bitumen cap sheets with four base sheet options are located in Chilliwack (British Columbia, Canada), Drummondville (Quebec, Canada), Gulfport (Mississippi, United States), Wadsworth (Ohio, United States) and Woodstock (Ontario, Canada). 3| DESCRIPTION OF THE PRODUCTS 3.1. Summary description and applications The SBS-modified bitumen membranes manufactured by SOPREMA are trusted to protect against weather conditions, temperature extremes, impacts, and foot traffic. Moreover, they provide beauty, affordability and reliability. The membranes are used on low-slope roofs (with slopes less than 2:12). They are available in a wide range of thicknesses and mechanical properties, able to adapt to many roof design challenges. SBS-modified bitumen membranes are composed of two sheets (base and cap sheets) and can be installed in various application modes1. This EPD evaluates four types of SBS-modified bitumen membranes manufactured by SOPREMA: a torch-applied (T) cap sheet with a base sheet installed using one of the following modes: torch-applied (T), mechanically fastened (F), self-adhered (S) or hot-mopped (M). To summarize, the four types of SBS-modified bitumen membranes are: 1. Base sheet (T) + Cap sheet (T) 2. Base sheet (F) + Cap sheet (T) 3. Base sheet (S) + Cap sheet (T) 4. Base sheet (M) + Cap sheet (T) These membrane sheets are made up of fibreglass and/or polyester reinforcing mats, SBS-modified bitumen, mineral stabilizers and surfacing materials. 1 For more information about the installation mode, please read Section 3.9.
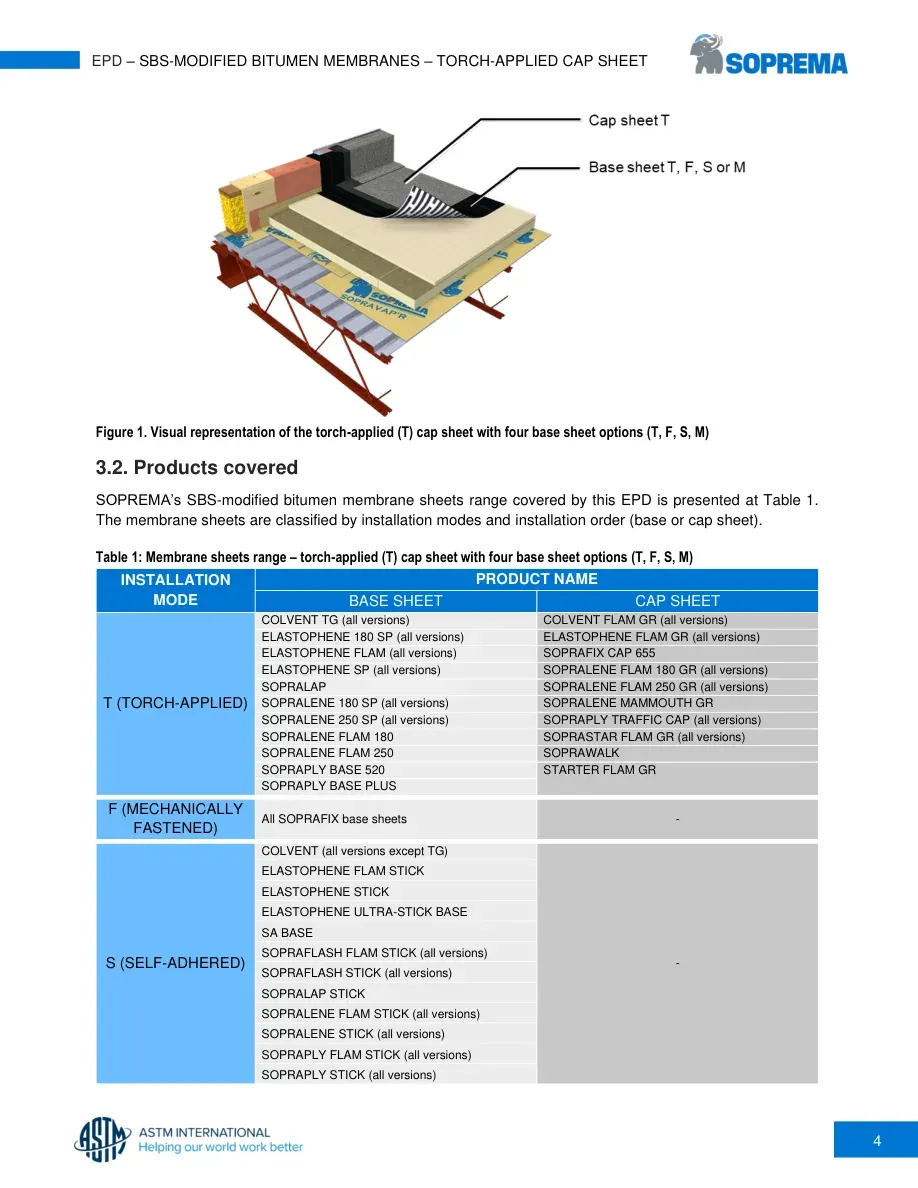
4 EPD – SBS-MODIFIED BITUMEN MEMBRANES – TORCH-APPLIED CAP SHEET Figure 1. Visual representation of the torch-applied (T) cap sheet with four base sheet options (T, F, S, M) 3.2. Products covered SOPREMA’s SBS-modified bitumen membrane sheets range covered by this EPD is presented at Table 1. The membrane sheets are classified by installation modes and installation order (base or cap sheet). Table 1: Membrane sheets range – torch-applied (T) cap sheet with four base sheet options (T, F, S, M) INSTALLATION MODE PRODUCT NAME BASE SHEET CAP SHEET T (TORCH-APPLIED) COLVENT TG (all versions) COLVENT FLAM GR (all versions) ELASTOPHENE 180 SP (all versions) ELASTOPHENE FLAM GR (all versions) ELASTOPHENE FLAM (all versions) SOPRAFIX CAP 655 ELASTOPHENE SP (all versions) SOPRALENE FLAM 180 GR (all versions) SOPRALAP SOPRALENE FLAM 250 GR (all versions) SOPRALENE 180 SP (all versions) SOPRALENE MAMMOUTH GR SOPRALENE 250 SP (all versions) SOPRAPLY TRAFFIC CAP (all versions) SOPRALENE FLAM 180 SOPRASTAR FLAM GR (all versions) SOPRALENE FLAM 250 SOPRAWALK SOPRAPLY BASE 520 STARTER FLAM GR SOPRAPLY BASE PLUS F (MECHANICALLY FASTENED) All SOPRAFIX base sheets - S (SELF-ADHERED) COLVENT (all versions except TG) - ELASTOPHENE FLAM STICK ELASTOPHENE STICK ELASTOPHENE ULTRA-STICK BASE SA BASE SOPRAFLASH FLAM STICK (all versions) SOPRAFLASH STICK (all versions) SOPRALAP STICK SOPRALENE FLAM STICK (all versions) SOPRALENE STICK (all versions) SOPRAPLY FLAM STICK (all versions) SOPRAPLY STICK (all versions)
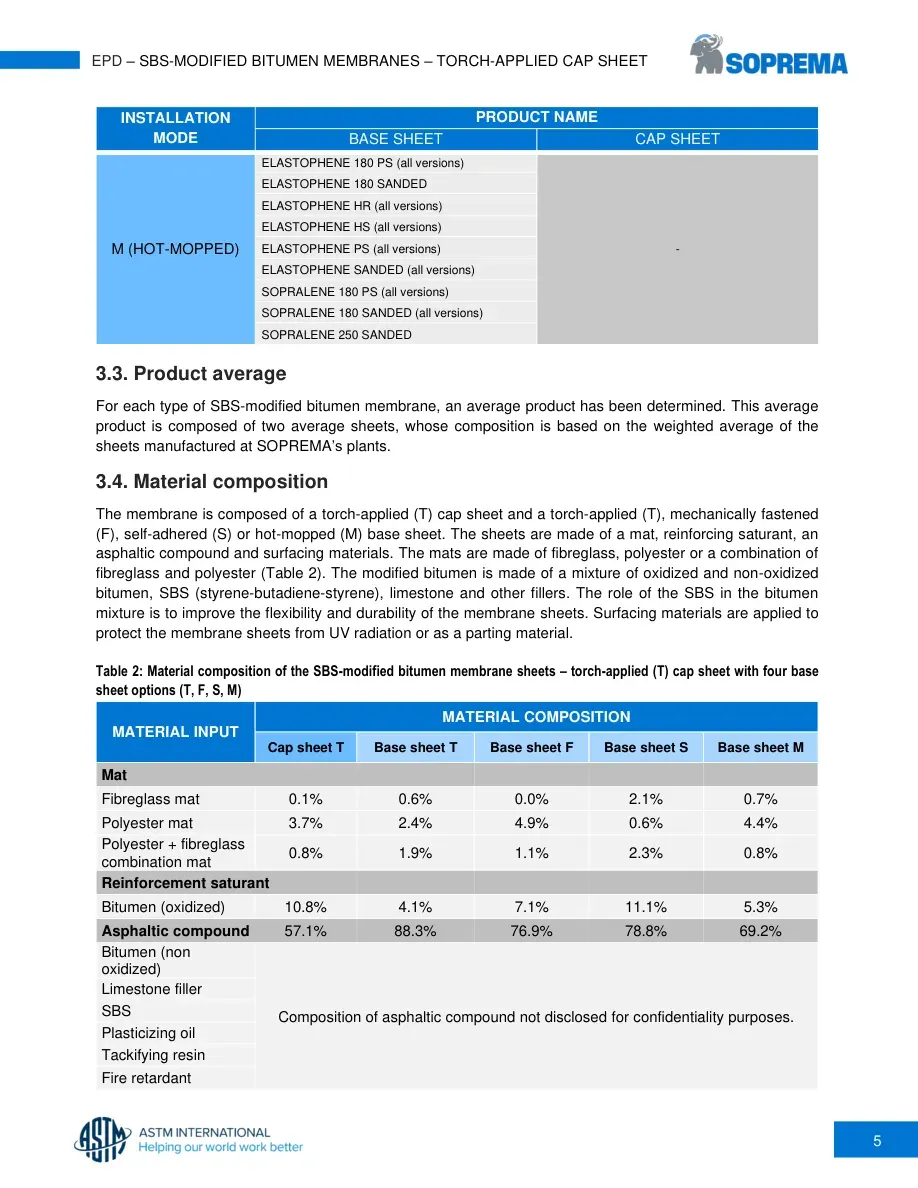
5 EPD – SBS-MODIFIED BITUMEN MEMBRANES – TORCH-APPLIED CAP SHEET INSTALLATION MODE PRODUCT NAME BASE SHEET CAP SHEET M (HOT-MOPPED) ELASTOPHENE 180 PS (all versions) - ELASTOPHENE 180 SANDED ELASTOPHENE HR (all versions) ELASTOPHENE HS (all versions) ELASTOPHENE PS (all versions) ELASTOPHENE SANDED (all versions) SOPRALENE 180 PS (all versions) SOPRALENE 180 SANDED (all versions) SOPRALENE 250 SANDED 3.3. Product average For each type of SBS-modified bitumen membrane, an average product has been determined. This average product is composed of two average sheets, whose composition is based on the weighted average of the sheets manufactured at SOPREMA’s plants. 3.4. Material composition The membrane is composed of a torch-applied (T) cap sheet and a torch-applied (T), mechanically fastened (F), self-adhered (S) or hot-mopped (M) base sheet. The sheets are made of a mat, reinforcing saturant, an asphaltic compound and surfacing materials. The mats are made of fibreglass, polyester or a combination of fibreglass and polyester (Table 2). The modified bitumen is made of a mixture of oxidized and non-oxidized bitumen, SBS (styrene-butadiene-styrene), limestone and other fillers. The role of the SBS in the bitumen mixture is to improve the flexibility and durability of the membrane sheets. Surfacing materials are applied to protect the membrane sheets from UV radiation or as a parting material. Table 2: Material composition of the SBS-modified bitumen membrane sheets – torch-applied (T) cap sheet with four base sheet options (T, F, S, M) MATERIAL INPUT MATERIAL COMPOSITION Cap sheet T Base sheet T Base sheet F Base sheet S Base sheet M Mat Fibreglass mat 0.1% 0.6% 0.0% 2.1% 0.7% Polyester mat 3.7% 2.4% 4.9% 0.6% 4.4% Polyester + fibreglass combination mat 0.8% 1.9% 1.1% 2.3% 0.8% Reinforcement saturant Bitumen (oxidized) 10.8% 4.1% 7.1% 11.1% 5.3% Asphaltic compound 57.1% 88.3% 76.9% 78.8% 69.2% Bitumen (non oxidized) Composition of asphaltic compound not disclosed for confidentiality purposes. Limestone filler SBS Plasticizing oil Tackifying resin Fire retardant
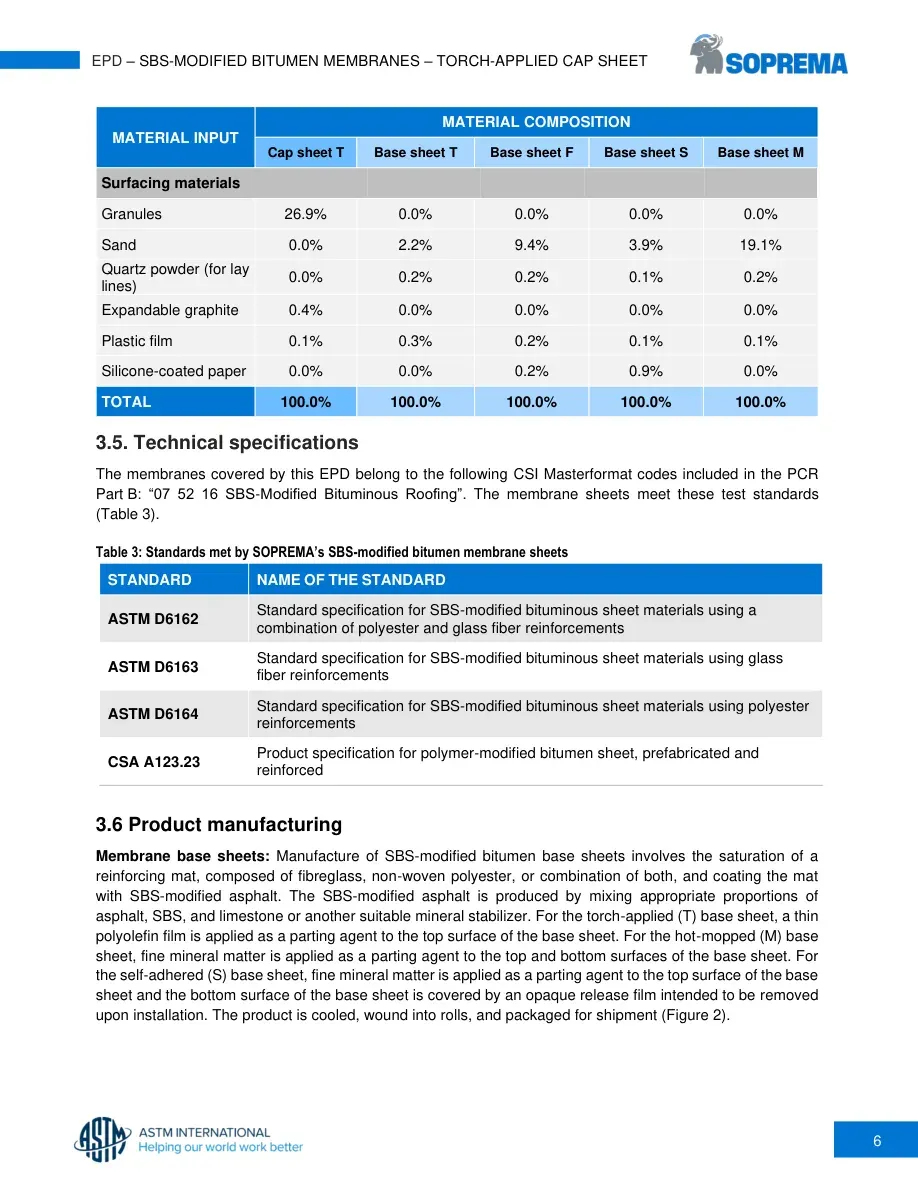
6 EPD – SBS-MODIFIED BITUMEN MEMBRANES – TORCH-APPLIED CAP SHEET MATERIAL INPUT MATERIAL COMPOSITION Cap sheet T Base sheet T Base sheet F Base sheet S Base sheet M Surfacing materials Granules 26.9% 0.0% 0.0% 0.0% 0.0% Sand 0.0% 2.2% 9.4% 3.9% 19.1% Quartz powder (for lay lines) 0.0% 0.2% 0.2% 0.1% 0.2% Expandable graphite 0.4% 0.0% 0.0% 0.0% 0.0% Plastic film 0.1% 0.3% 0.2% 0.1% 0.1% Silicone-coated paper 0.0% 0.0% 0.2% 0.9% 0.0% TOTAL 100.0% 100.0% 100.0% 100.0% 100.0% 3.5. Technical specifications The membranes covered by this EPD belong to the following CSI Masterformat codes included in the PCR Part B: “07 52 16 SBS-Modified Bituminous Roofing”. The membrane sheets meet these test standards (Table 3). Table 3: Standards met by SOPREMA’s SBS-modified bitumen membrane sheets 3.6 Product manufacturing Membrane base sheets: Manufacture of SBS-modified bitumen base sheets involves the saturation of a reinforcing mat, composed of fibreglass, non-woven polyester, or combination of both, and coating the mat with SBS-modified asphalt. The SBS-modified asphalt is produced by mixing appropriate proportions of asphalt, SBS, and limestone or another suitable mineral stabilizer. For the torch-applied (T) base sheet, a thin polyolefin film is applied as a parting agent to the top surface of the base sheet. For the hot-mopped (M) base sheet, fine mineral matter is applied as a parting agent to the top and bottom surfaces of the base sheet. For the self-adhered (S) base sheet, fine mineral matter is applied as a parting agent to the top surface of the base sheet and the bottom surface of the base sheet is covered by an opaque release film intended to be removed upon installation. The product is cooled, wound into rolls, and packaged for shipment (Figure 2). STANDARD NAME OF THE STANDARD ASTM D6162 Standard specification for SBS-modified bituminous sheet materials using a combination of polyester and glass fiber reinforcements ASTM D6163 Standard specification for SBS-modified bituminous sheet materials using glass fiber reinforcements ASTM D6164 Standard specification for SBS-modified bituminous sheet materials using polyester reinforcements CSA A123.23 Product specification for polymer-modified bitumen sheet, prefabricated and reinforced
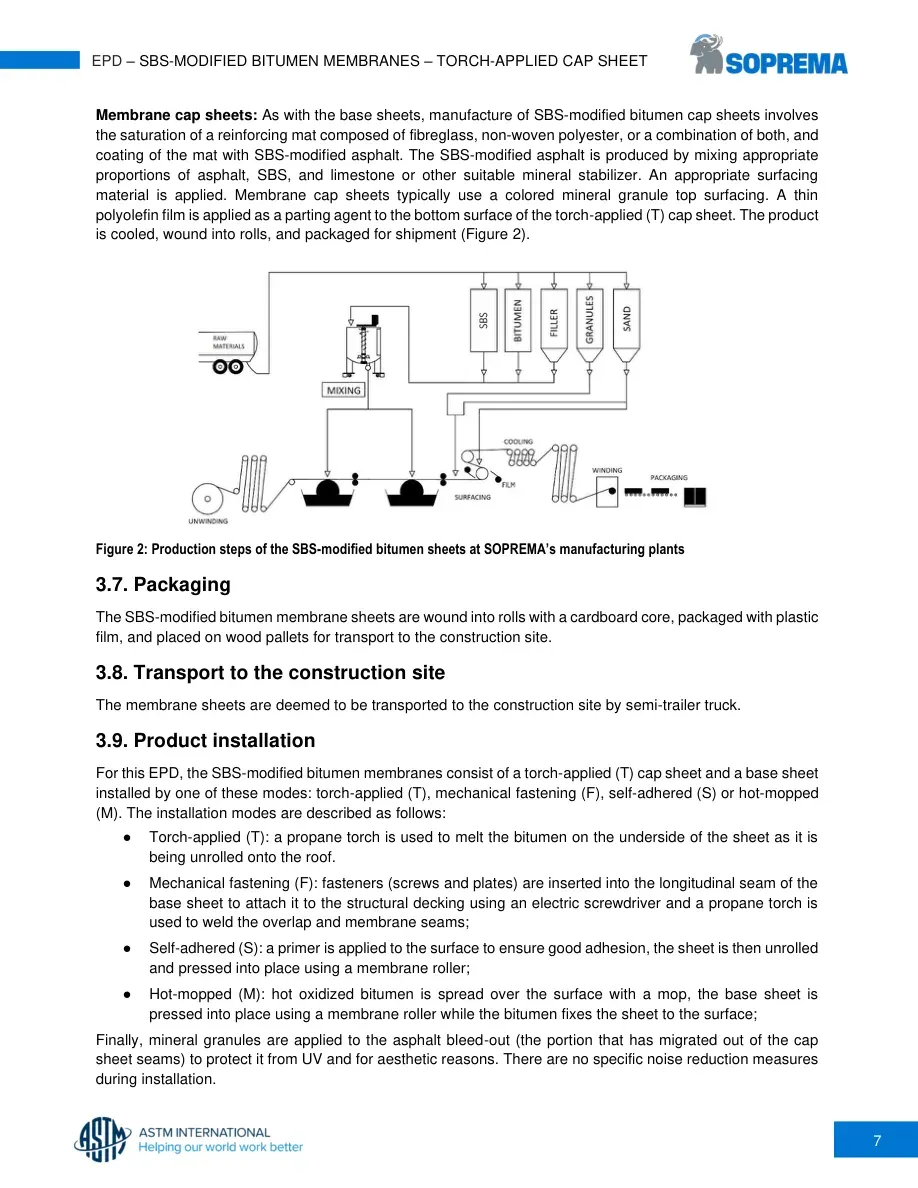
7 EPD – SBS-MODIFIED BITUMEN MEMBRANES – TORCH-APPLIED CAP SHEET Membrane cap sheets: As with the base sheets, manufacture of SBS-modified bitumen cap sheets involves the saturation of a reinforcing mat composed of fibreglass, non-woven polyester, or a combination of both, and coating of the mat with SBS-modified asphalt. The SBS-modified asphalt is produced by mixing appropriate proportions of asphalt, SBS, and limestone or other suitable mineral stabilizer. An appropriate surfacing material is applied. Membrane cap sheets typically use a colored mineral granule top surfacing. A thin polyolefin film is applied as a parting agent to the bottom surface of the torch-applied (T) cap sheet. The product is cooled, wound into rolls, and packaged for shipment (Figure 2). Figure 2: Production steps of the SBS-modified bitumen sheets at SOPREMA’s manufacturing plants 3.7. Packaging The SBS-modified bitumen membrane sheets are wound into rolls with a cardboard core, packaged with plastic film, and placed on wood pallets for transport to the construction site. 3.8. Transport to the construction site The membrane sheets are deemed to be transported to the construction site by semi-trailer truck. 3.9. Product installation For this EPD, the SBS-modified bitumen membranes consist of a torch-applied (T) cap sheet and a base sheet installed by one of these modes: torch-applied (T), mechanical fastening (F), self-adhered (S) or hot-mopped (M). The installation modes are described as follows: ● Torch-applied (T): a propane torch is used to melt the bitumen on the underside of the sheet as it is being unrolled onto the roof. ● Mechanical fastening (F): fasteners (screws and plates) are inserted into the longitudinal seam of the base sheet to attach it to the structural decking using an electric screwdriver and a propane torch is used to weld the overlap and membrane seams; ● Self-adhered (S): a primer is applied to the surface to ensure good adhesion, the sheet is then unrolled and pressed into place using a membrane roller; ● Hot-mopped (M): hot oxidized bitumen is spread over the surface with a mop, the base sheet is pressed into place using a membrane roller while the bitumen fixes the sheet to the surface; Finally, mineral granules are applied to the asphalt bleed-out (the portion that has migrated out of the cap sheet seams) to protect it from UV and for aesthetic reasons. There are no specific noise reduction measures during installation.
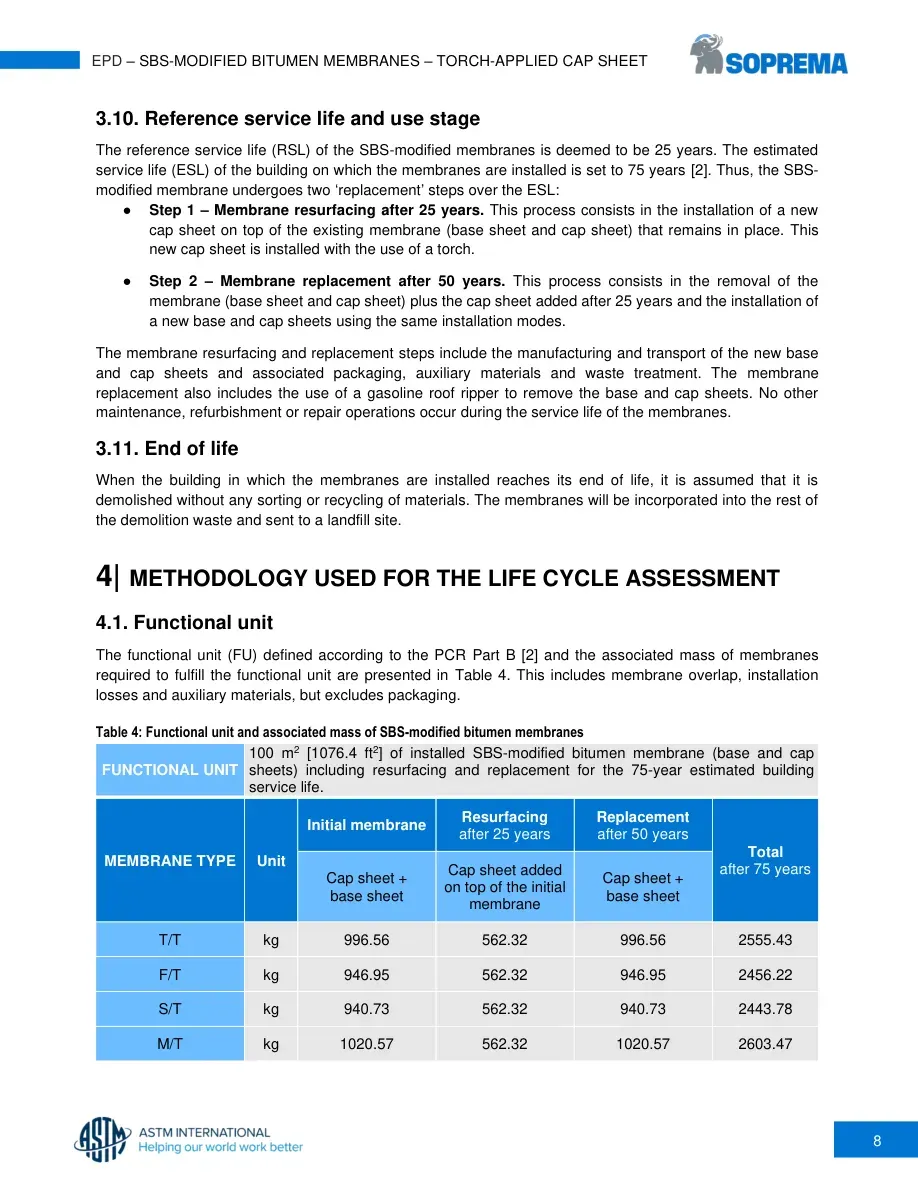
8 EPD – SBS-MODIFIED BITUMEN MEMBRANES – TORCH-APPLIED CAP SHEET 3.10. Reference service life and use stage The reference service life (RSL) of the SBS-modified membranes is deemed to be 25 years. The estimated service life (ESL) of the building on which the membranes are installed is set to 75 years [2]. Thus, the SBS-modified membrane undergoes two ‘replacement’ steps over the ESL: ● Step 1 – Membrane resurfacing after 25 years. This process consists in the installation of a new cap sheet on top of the existing membrane (base sheet and cap sheet) that remains in place. This new cap sheet is installed with the use of a torch. ● Step 2 – Membrane replacement after 50 years. This process consists in the removal of the membrane (base sheet and cap sheet) plus the cap sheet added after 25 years and the installation of a new base and cap sheets using the same installation modes. The membrane resurfacing and replacement steps include the manufacturing and transport of the new base and cap sheets and associated packaging, auxiliary materials and waste treatment. The membrane replacement also includes the use of a gasoline roof ripper to remove the base and cap sheets. No other maintenance, refurbishment or repair operations occur during the service life of the membranes. 3.11. End of life When the building in which the membranes are installed reaches its end of life, it is assumed that it is demolished without any sorting or recycling of materials. The membranes will be incorporated into the rest of the demolition waste and sent to a landfill site. 4| METHODOLOGY USED FOR THE LIFE CYCLE ASSESSMENT 4.1. Functional unit The functional unit (FU) defined according to the PCR Part B [2] and the associated mass of membranes required to fulfill the functional unit are presented in Table 4. This includes membrane overlap, installation losses and auxiliary materials, but excludes packaging. Table 4: Functional unit and associated mass of SBS-modified bitumen membranes FUNCTIONAL UNIT 100 m2 [1076.4 ft2] of installed SBS-modified bitumen membrane (base and cap sheets) including resurfacing and replacement for the 75-year estimated building service life. MEMBRANE TYPE Unit Initial membrane Resurfacing after 25 years Replacement after 50 years Total after 75 years Cap sheet + base sheet Cap sheet added on top of the initial membrane Cap sheet + base sheet T/T kg 996.56 562.32 996.56 2555.43 F/T kg 946.95 562.32 946.95 2456.22 S/T kg 940.73 562.32 940.73 2443.78 M/T kg 1020.57 562.32 1020.57 2603.47
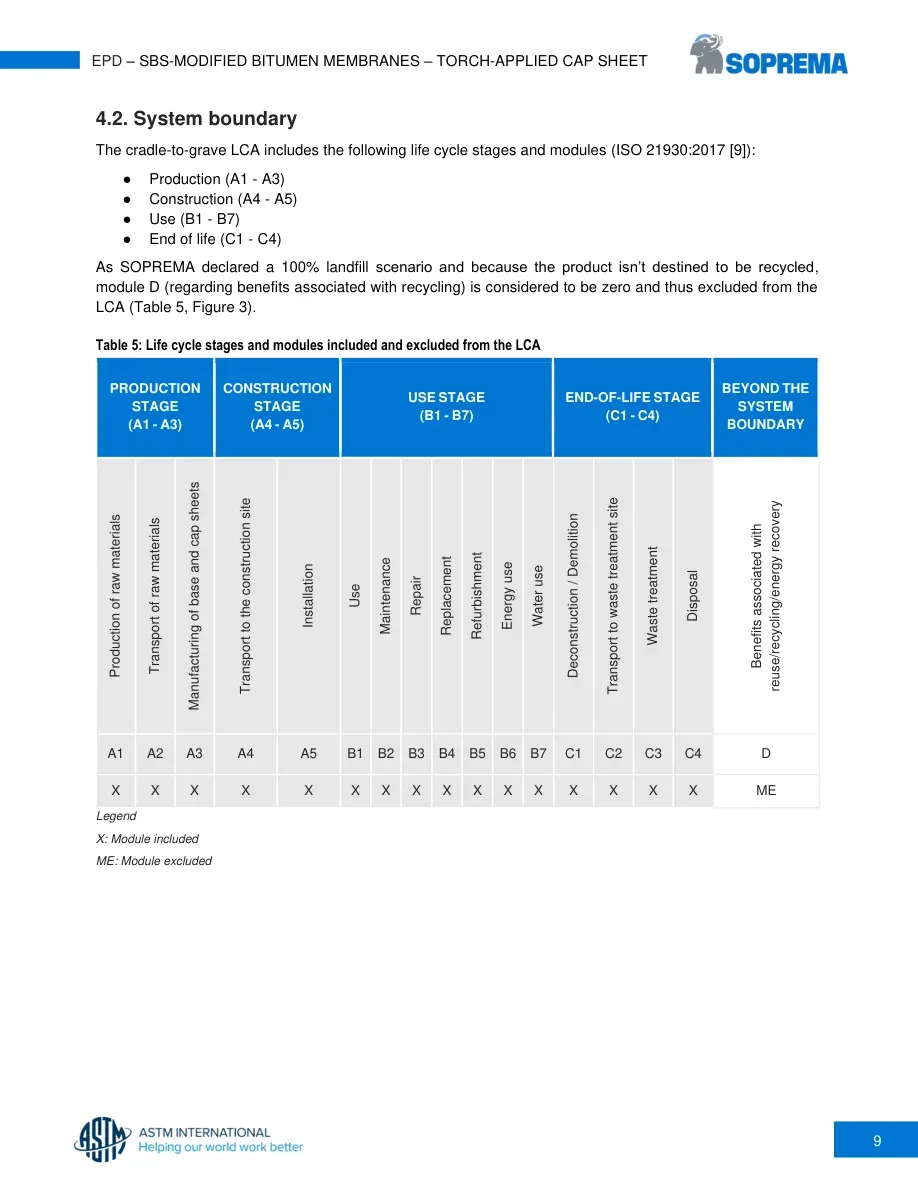
9 EPD – SBS-MODIFIED BITUMEN MEMBRANES – TORCH-APPLIED CAP SHEET 4.2. System boundary The cradle-to-grave LCA includes the following life cycle stages and modules (ISO 21930:2017 [9]): ● Production (A1 - A3) ● Construction (A4 - A5) ● Use (B1 - B7) ● End of life (C1 - C4) As SOPREMA declared a 100% landfill scenario and because the product isn’t destined to be recycled, module D (regarding benefits associated with recycling) is considered to be zero and thus excluded from the LCA (Table 5, Figure 3). Table 5: Life cycle stages and modules included and excluded from the LCA PRODUCTION STAGE (A1 - A3) CONSTRUCTION STAGE (A4 - A5) USE STAGE (B1 - B7) END-OF-LIFE STAGE (C1 - C4) BEYOND THE SYSTEM BOUNDARY Production of raw materials Transport of raw materials Manufacturing of base and cap sheets Transport to the construction site Installation Use Maintenance Repair Replacement Refurbishment Energy use Water use Deconstruction / Demolition Transport to waste treatment site Waste treatment Disposal Benefits associated with reuse/recycling/energy recovery A1 A2 A3 A4 A5 B1 B2 B3 B4 B5 B6 B7 C1 C2 C3 C4 D X X X X X X X X X X X X X X X X ME Legend X: Module included ME: Module excluded
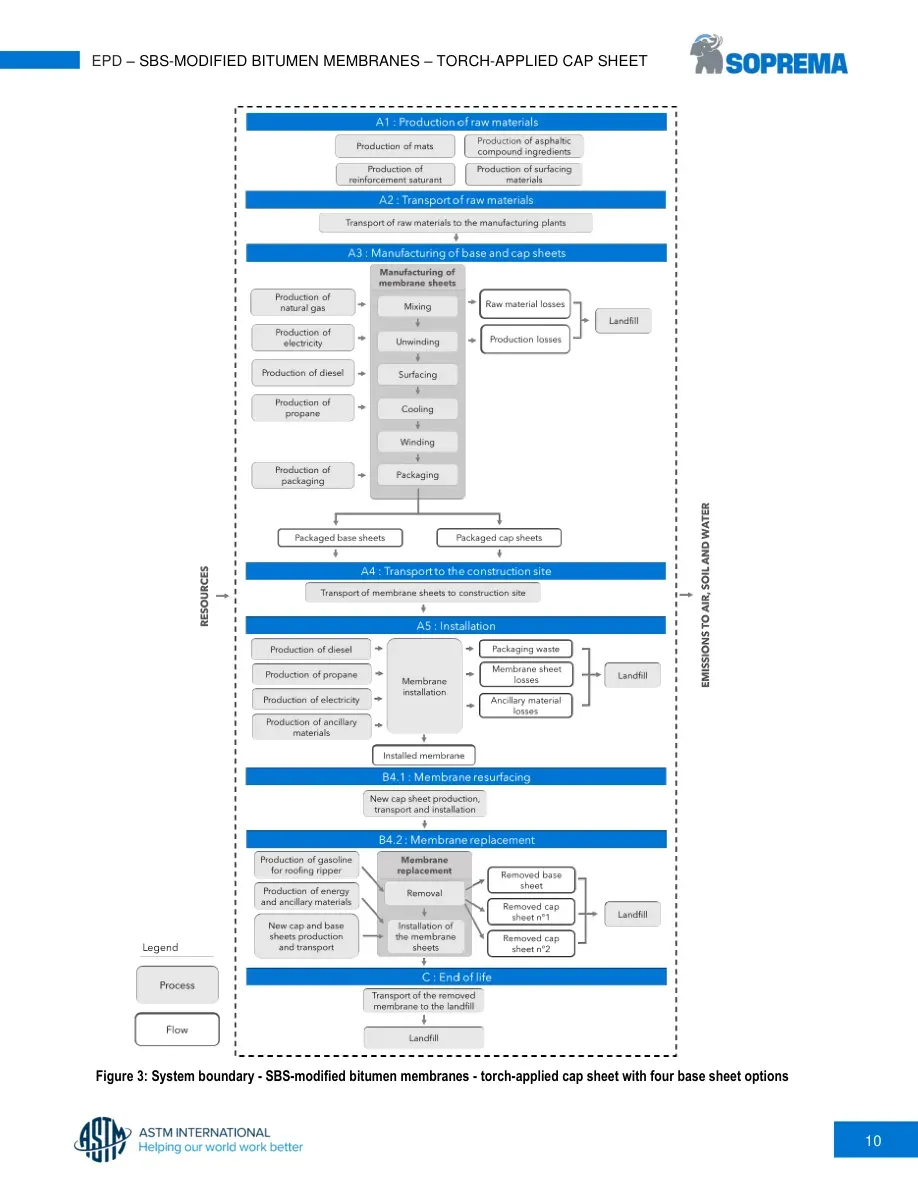
10 EPD – SBS-MODIFIED BITUMEN MEMBRANES – TORCH-APPLIED CAP SHEET Figure 3: System boundary - SBS-modified bitumen membranes - torch-applied cap sheet with four base sheet options
11 EPD – SBS-MODIFIED BITUMEN MEMBRANES – TORCH-APPLIED CAP SHEET 4.3. Reference period The reference period is the calendar year 2022 (from 1 January 2022 to 31 December 2022). 4.4. Assumptions Carrying out an LCA involves making assumptions when data is incomplete or missing. The following assumptions were applied with respect to the present LCA: ● Production of non-oxidized bitumen and SBS (A1). In the absence of appropriate secondary data to model the non-oxidized bitumen and the SBS in Ecoinvent v3.9.1, these materials were modelled from the Asphalt Institute’s LCA report [10]. ● Production of oxidized bitumen (A1). Oxidized bitumen is bitumen that has been subjected to a controlled reaction with air or oxygen at elevated temperatures to improve thermal and aging properties [11]. Since no oxidized bitumen production process was available, the oxidized bitumen production is modelled as non-oxidized bitumen. ● Packaging end of life (A5). Based on the PCR Part A [1], the plastic product packaging is assumed to be 78% recycled and 22% landfilled, and the other product packaging (wood pallets, cardboard) to be 20% recycled and 80% landfilled at the end of their life (mass ratio). 4.5. Cut-off criteria As defined in ISO 21930:2017 [9], all input and output processes whose mass and/or energy flow account for more than 1% of the total mass and/or cumulative energy of the SBS-modified bitumen membranes were included. Also in line with the standard, at least 95% of all mass and energy flows were included. The packaging of raw materials is excluded, as this flow represents less than 1% of the mass of inputs and does not represent a significant environmental impact. The production and maintenance of equipment and infrastructure, administration activities, transport of employees and removal of debris from the roof drains during use were not included. No known mass or energy flows were deliberately excluded from this EPD. 4.6. Allocation When a process in the life cycle of a product generates several outputs (multifunctional processes) or is linked to another system (life cycle of a product outside the boundary of the system studied), the environmental impact of the process must be allocated to the different products, co-products and systems. The allocation methods considered for this study are: ● Allocation for end-of-life processes. The “cut-off” approach was chosen in accordance with ISO 21930:2017 [9]. This approach specifies that the impacts associated with secondary materials entering the system are attributable to the system that generated them, and the benefits associated with recycling materials leaving the system are not included. In this study, the only impacts associated with the recycled polyester are those of its processing and transport to the manufacturing plant. Using the same principle, no environmental benefits associated with the part of packaging materials sent for recycling (cardboard, plastic film, wood pallet) were accounted for. ● Allocation for multi-functional processes. There are no multifunctional processes involved in the life cycle of the membranes. ● Allocation approach for Ecoinvent datasets. The Ecoinvent datasets used the “Allocation, cut-off by classification” allocation approach, which attributes the impacts of secondary materials entering the system to those that generated them, and excludes the benefits associated with recycling materials. This is in line with the cut-off rule specified in ISO 21930:2017.
12 EPD – SBS-MODIFIED BITUMEN MEMBRANES – TORCH-APPLIED CAP SHEET 4.7. Data sources and quality Table 6: Inventory data sources for SBS-modified bitumen membranes DATA TYPE SOURCE Foreground data Primary foreground data was provided by SOPREMA regarding: ● measured data regarding the raw materials and transport; ● measured data regarding the manufacturing of the sheets and their packaging; ● data based on realistic scenarios supported by technical information regarding the auxiliary materials and losses during the installation of the membranes; ● data based on realistic scenarios regarding the membrane resurfacing and replacement during the estimated building service life. Foreground data Secondary foreground data regarding the transport distance of the sheets to the construction site and of the removed membrane to the waste treatment site at its end of life (module A4) as well as the energy for the kettle and pump in the hot-mopped installation mode for the base sheet (module A5) were obtained from the PCR Part B [2]. Background data The background data was obtained from the following sources: ● technical reports (LCA of the bitumen and SBS [10][12]); ● Ecoinvent database v3.9.1 [4], a transparent and internationally recognized life cycle inventory database. Table 7: Data quality assessment CRITERION EVALUATION Temporal representativeness The primary foreground data supplied by SOPREMA is representative of the reference period (year 2022). The secondary foreground data comes from the PCR Part B (2021) and technical reports issued in 2019 and 2023. As for the Ecoinvent database, the 3.9.1 version (2022) is based on version 3.0, which has been released annually since 2013. It should be noted that some of the data in version 3.0 comes from earlier versions (1991-2012). The foreground and background data are considered to have a high temporal representativeness. Geographical representativeness The primary foreground data related to the life cycle stages of the membranes represents the specific context of SOPREMA. The data based on realistic assumptions regarding the installation and the use of the membranes are supported by technical information from SOPREMA. The secondary foreground data is based on the PCR Part B (North American context). The background data used to model the bitumen and SBS is based on a report from the Asphalt Institute and is representative of the North American context. The electricity used at the manufacturing plant is representative of the regional grid mix. The background datasets were selected according to geographical representativeness. The foreground and background data are considered to have a high geographical representativeness.
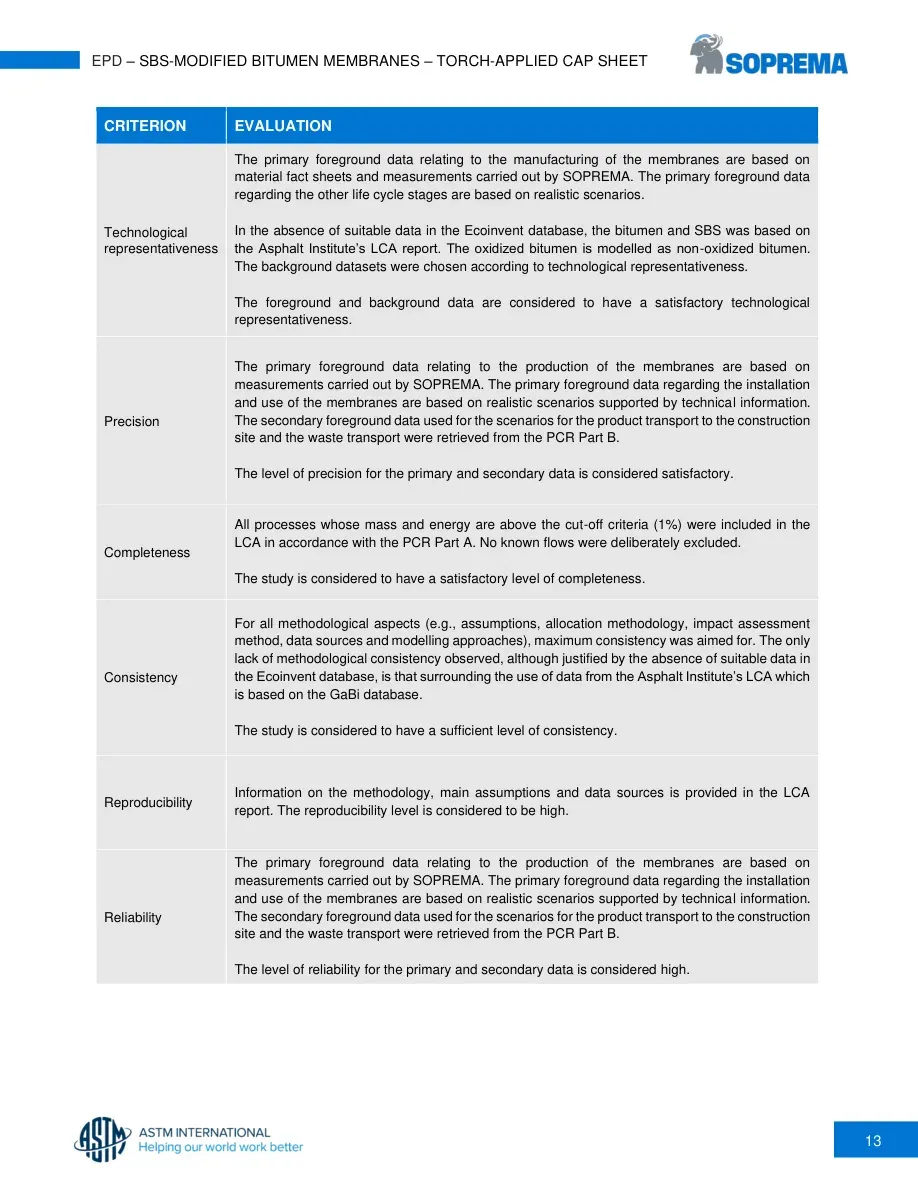
13 EPD – SBS-MODIFIED BITUMEN MEMBRANES – TORCH-APPLIED CAP SHEET CRITERION EVALUATION Technological representativeness The primary foreground data relating to the manufacturing of the membranes are based on material fact sheets and measurements carried out by SOPREMA. The primary foreground data regarding the other life cycle stages are based on realistic scenarios. In the absence of suitable data in the Ecoinvent database, the bitumen and SBS was based on the Asphalt Institute’s LCA report. The oxidized bitumen is modelled as non-oxidized bitumen. The background datasets were chosen according to technological representativeness. The foreground and background data are considered to have a satisfactory technological representativeness. Precision The primary foreground data relating to the production of the membranes are based on measurements carried out by SOPREMA. The primary foreground data regarding the installation and use of the membranes are based on realistic scenarios supported by technical information. The secondary foreground data used for the scenarios for the product transport to the construction site and the waste transport were retrieved from the PCR Part B. The level of precision for the primary and secondary data is considered satisfactory. Completeness All processes whose mass and energy are above the cut-off criteria (1%) were included in the LCA in accordance with the PCR Part A. No known flows were deliberately excluded. The study is considered to have a satisfactory level of completeness. Consistency For all methodological aspects (e.g., assumptions, allocation methodology, impact assessment method, data sources and modelling approaches), maximum consistency was aimed for. The only lack of methodological consistency observed, although justified by the absence of suitable data in the Ecoinvent database, is that surrounding the use of data from the Asphalt Institute’s LCA which is based on the GaBi database. The study is considered to have a sufficient level of consistency. Reproducibility Information on the methodology, main assumptions and data sources is provided in the LCA report. The reproducibility level is considered to be high. Reliability The primary foreground data relating to the production of the membranes are based on measurements carried out by SOPREMA. The primary foreground data regarding the installation and use of the membranes are based on realistic scenarios supported by technical information. The secondary foreground data used for the scenarios for the product transport to the construction site and the waste transport were retrieved from the PCR Part B. The level of reliability for the primary and secondary data is considered high.
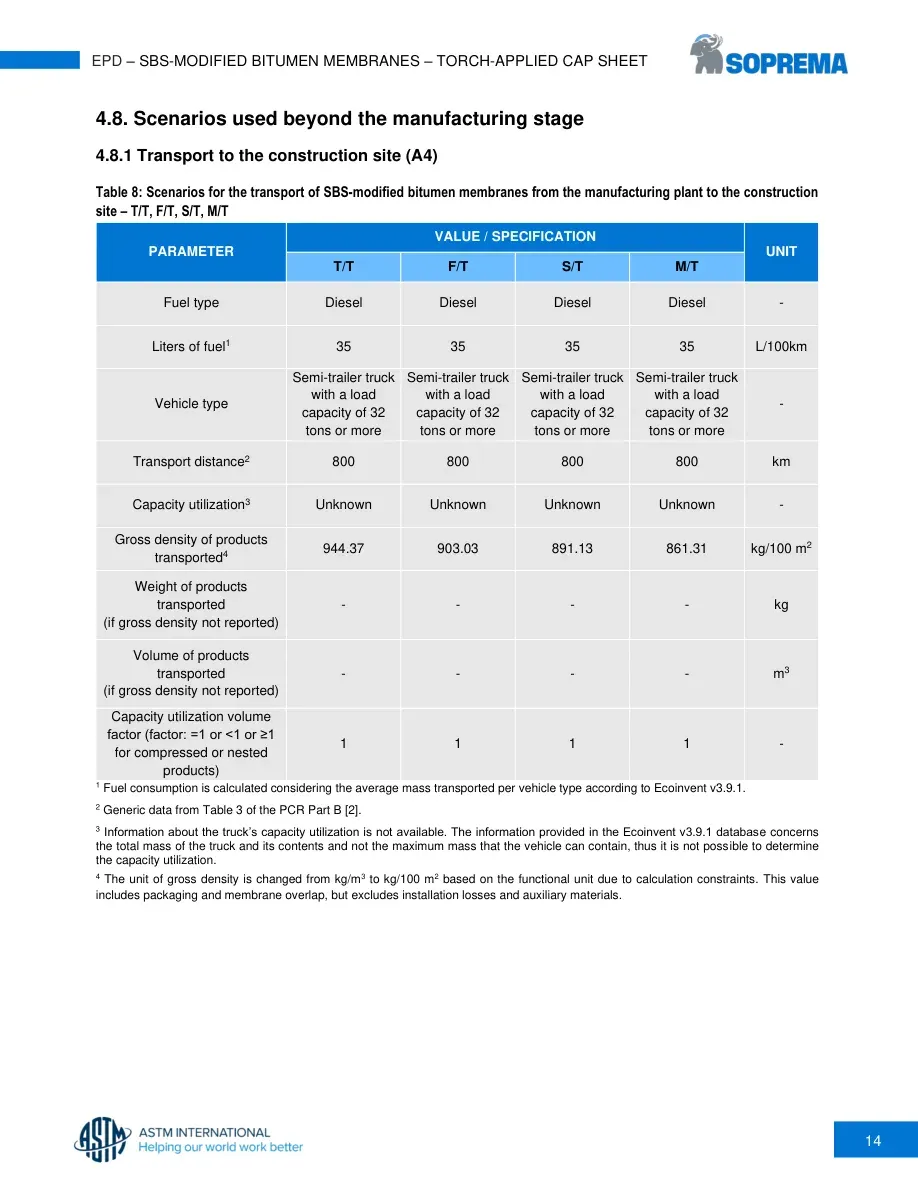
14 EPD – SBS-MODIFIED BITUMEN MEMBRANES – TORCH-APPLIED CAP SHEET 4.8. Scenarios used beyond the manufacturing stage 4.8.1 Transport to the construction site (A4) Table 8: Scenarios for the transport of SBS-modified bitumen membranes from the manufacturing plant to the construction site – T/T, F/T, S/T, M/T PARAMETER VALUE / SPECIFICATION UNIT T/T F/T S/T M/T Fuel type Diesel Diesel Diesel Diesel - Liters of fuel1 35 35 35 35 L/100km Vehicle type Semi-trailer truck with a load capacity of 32 tons or more Semi-trailer truck with a load capacity of 32 tons or more Semi-trailer truck with a load capacity of 32 tons or more Semi-trailer truck with a load capacity of 32 tons or more - Transport distance2 800 800 800 800 km Capacity utilization3 Unknown Unknown Unknown Unknown - Gross density of products transported4 944.37 903.03 891.13 861.31 kg/100 m2 Weight of products transported (if gross density not reported) - - - - kg Volume of products transported (if gross density not reported) - - - - m3 Capacity utilization volume factor (factor: =1 or <1 or ≥1 for compressed or nested products) 1 1 1 1 - 1 Fuel consumption is calculated considering the average mass transported per vehicle type according to Ecoinvent v3.9.1. 2 Generic data from Table 3 of the PCR Part B [2]. 3 Information about the truck’s capacity utilization is not available. The information provided in the Ecoinvent v3.9.1 database concerns the total mass of the truck and its contents and not the maximum mass that the vehicle can contain, thus it is not possible to determine the capacity utilization. 4 The unit of gross density is changed from kg/m3 to kg/100 m2 based on the functional unit due to calculation constraints. This value includes packaging and membrane overlap, but excludes installation losses and auxiliary materials.
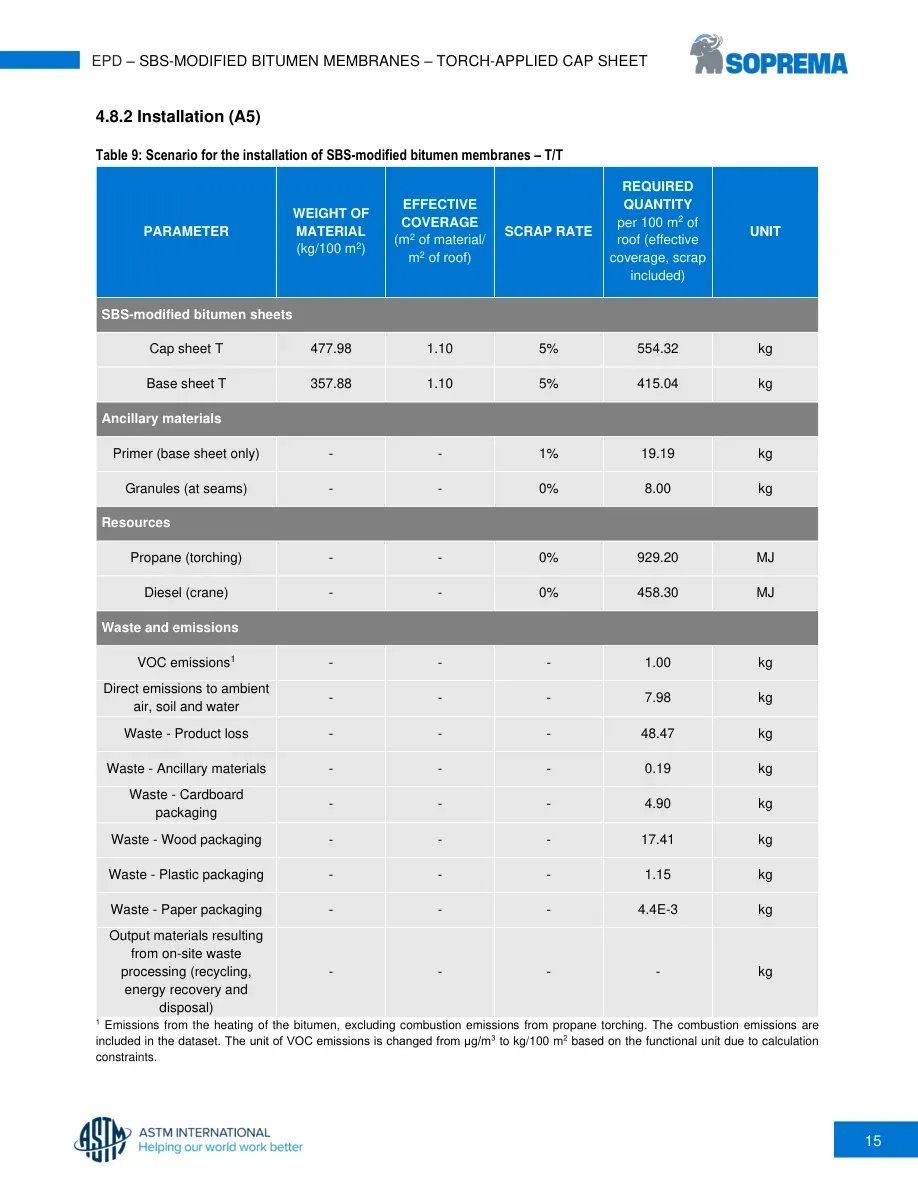
15 EPD – SBS-MODIFIED BITUMEN MEMBRANES – TORCH-APPLIED CAP SHEET 4.8.2 Installation (A5) Table 9: Scenario for the installation of SBS-modified bitumen membranes – T/T PARAMETER WEIGHT OF MATERIAL (kg/100 m2) EFFECTIVE COVERAGE (m2 of material/ m2 of roof) SCRAP RATE REQUIRED QUANTITY per 100 m2 of roof (effective coverage, scrap included) UNIT SBS-modified bitumen sheets Cap sheet T 477.98 1.10 5% 554.32 kg Base sheet T 357.88 1.10 5% 415.04 kg Ancillary materials Primer (base sheet only) - - 1% 19.19 kg Granules (at seams) - - 0% 8.00 kg Resources Propane (torching) - - 0% 929.20 MJ Diesel (crane) - - 0% 458.30 MJ Waste and emissions VOC emissions1 - - - 1.00 kg Direct emissions to ambient air, soil and water - - - 7.98 kg Waste - Product loss - - - 48.47 kg Waste - Ancillary materials - - - 0.19 kg Waste - Cardboard packaging - - - 4.90 kg Waste - Wood packaging - - - 17.41 kg Waste - Plastic packaging - - - 1.15 kg Waste - Paper packaging - - - 4.4E-3 kg Output materials resulting from on-site waste processing (recycling, energy recovery and disposal) - - - - kg 1 Emissions from the heating of the bitumen, excluding combustion emissions from propane torching. The combustion emissions are included in the dataset. The unit of VOC emissions is changed from μg/m3 to kg/100 m2 based on the functional unit due to calculation constraints.
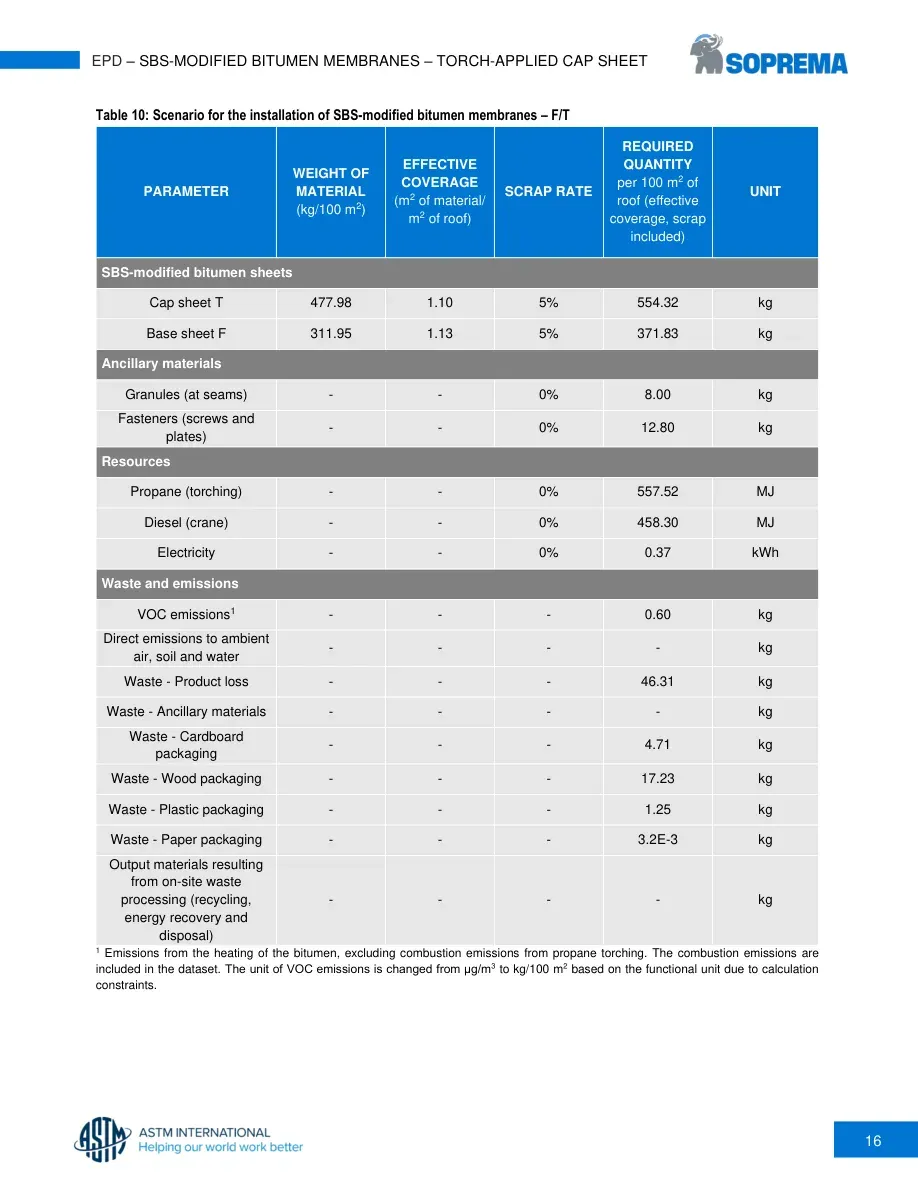
16 EPD – SBS-MODIFIED BITUMEN MEMBRANES – TORCH-APPLIED CAP SHEET Table 10: Scenario for the installation of SBS-modified bitumen membranes – F/T PARAMETER WEIGHT OF MATERIAL (kg/100 m2) EFFECTIVE COVERAGE (m2 of material/ m2 of roof) SCRAP RATE REQUIRED QUANTITY per 100 m2 of roof (effective coverage, scrap included) UNIT SBS-modified bitumen sheets Cap sheet T 477.98 1.10 5% 554.32 kg Base sheet F 311.95 1.13 5% 371.83 kg Ancillary materials Granules (at seams) - - 0% 8.00 kg Fasteners (screws and plates) - - 0% 12.80 kg Resources Propane (torching) - - 0% 557.52 MJ Diesel (crane) - - 0% 458.30 MJ Electricity - - 0% 0.37 kWh Waste and emissions VOC emissions1 - - - 0.60 kg Direct emissions to ambient air, soil and water - - - - kg Waste - Product loss - - - 46.31 kg Waste - Ancillary materials - - - - kg Waste - Cardboard packaging - - - 4.71 kg Waste - Wood packaging - - - 17.23 kg Waste - Plastic packaging - - - 1.25 kg Waste - Paper packaging - - - 3.2E-3 kg Output materials resulting from on-site waste processing (recycling, energy recovery and disposal) - - - - kg 1 Emissions from the heating of the bitumen, excluding combustion emissions from propane torching. The combustion emissions are included in the dataset. The unit of VOC emissions is changed from μg/m3 to kg/100 m2 based on the functional unit due to calculation constraints.
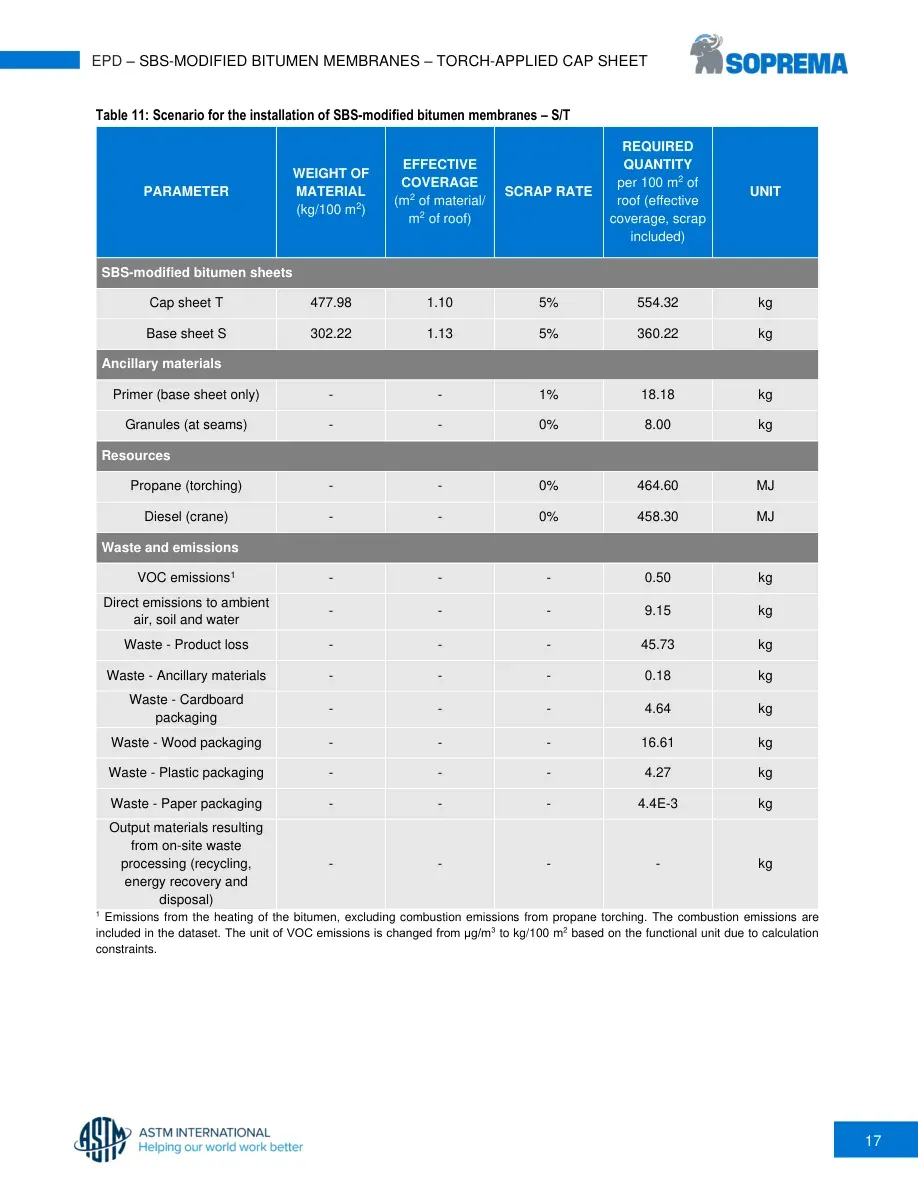
17 EPD – SBS-MODIFIED BITUMEN MEMBRANES – TORCH-APPLIED CAP SHEET Table 11: Scenario for the installation of SBS-modified bitumen membranes – S/T PARAMETER WEIGHT OF MATERIAL (kg/100 m2) EFFECTIVE COVERAGE (m2 of material/ m2 of roof) SCRAP RATE REQUIRED QUANTITY per 100 m2 of roof (effective coverage, scrap included) UNIT SBS-modified bitumen sheets Cap sheet T 477.98 1.10 5% 554.32 kg Base sheet S 302.22 1.13 5% 360.22 kg Ancillary materials Primer (base sheet only) - - 1% 18.18 kg Granules (at seams) - - 0% 8.00 kg Resources Propane (torching) - - 0% 464.60 MJ Diesel (crane) - - 0% 458.30 MJ Waste and emissions VOC emissions1 - - - 0.50 kg Direct emissions to ambient air, soil and water - - - 9.15 kg Waste - Product loss - - - 45.73 kg Waste - Ancillary materials - - - 0.18 kg Waste - Cardboard packaging - - - 4.64 kg Waste - Wood packaging - - - 16.61 kg Waste - Plastic packaging - - - 4.27 kg Waste - Paper packaging - - - 4.4E-3 kg Output materials resulting from on-site waste processing (recycling, energy recovery and disposal) - - - - kg 1 Emissions from the heating of the bitumen, excluding combustion emissions from propane torching. The combustion emissions are included in the dataset. The unit of VOC emissions is changed from μg/m3 to kg/100 m2 based on the functional unit due to calculation constraints.
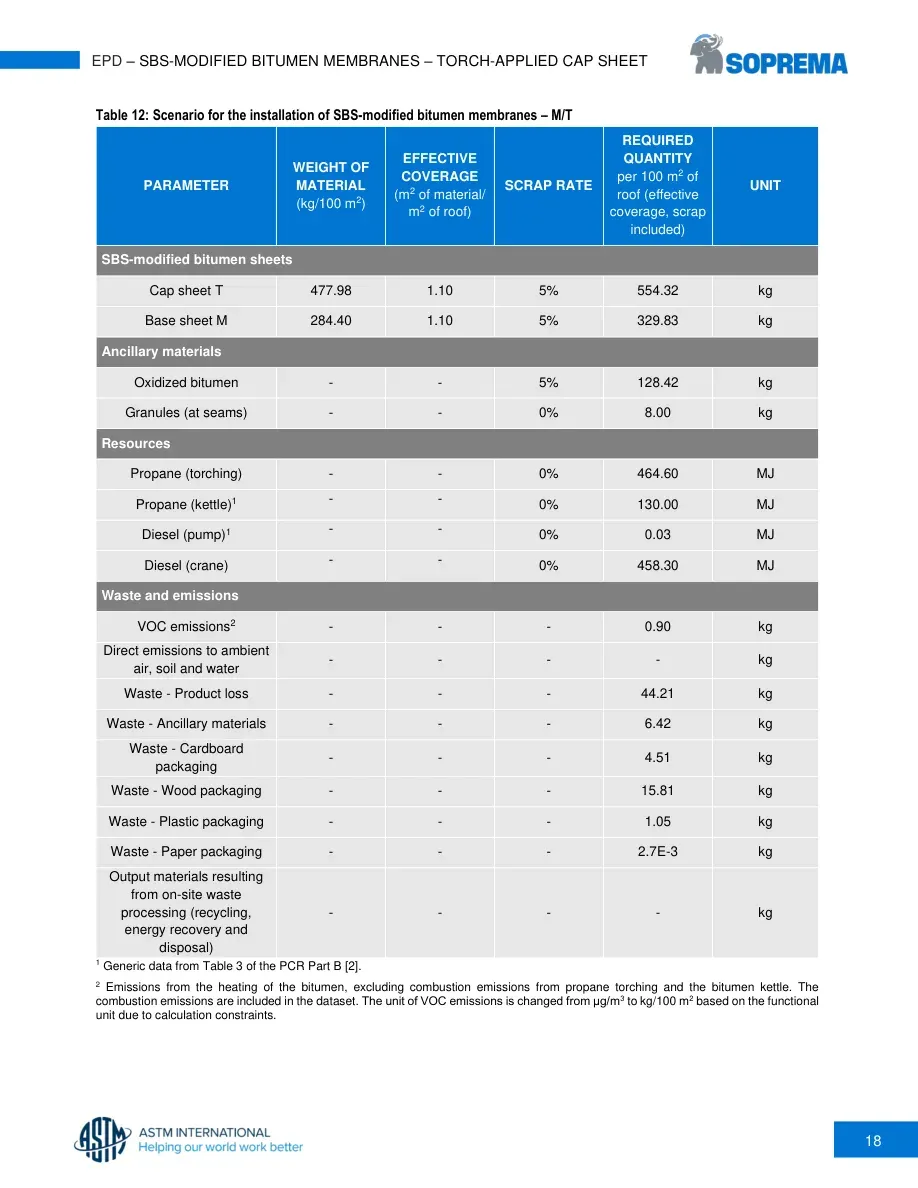
18 EPD – SBS-MODIFIED BITUMEN MEMBRANES – TORCH-APPLIED CAP SHEET Table 12: Scenario for the installation of SBS-modified bitumen membranes – M/T PARAMETER WEIGHT OF MATERIAL (kg/100 m2) EFFECTIVE COVERAGE (m2 of material/ m2 of roof) SCRAP RATE REQUIRED QUANTITY per 100 m2 of roof (effective coverage, scrap included) UNIT SBS-modified bitumen sheets Cap sheet T 477.98 1.10 5% 554.32 kg Base sheet M 284.40 1.10 5% 329.83 kg Ancillary materials Oxidized bitumen - - 5% 128.42 kg Granules (at seams) - - 0% 8.00 kg Resources Propane (torching) - - 0% 464.60 MJ Propane (kettle)1 - - 0% 130.00 MJ Diesel (pump)1 - - 0% 0.03 MJ Diesel (crane) - - 0% 458.30 MJ Waste and emissions VOC emissions2 - - - 0.90 kg Direct emissions to ambient air, soil and water - - - - kg Waste - Product loss - - - 44.21 kg Waste - Ancillary materials - - - 6.42 kg Waste - Cardboard packaging - - - 4.51 kg Waste - Wood packaging - - - 15.81 kg Waste - Plastic packaging - - - 1.05 kg Waste - Paper packaging - - - 2.7E-3 kg Output materials resulting from on-site waste processing (recycling, energy recovery and disposal) - - - - kg 1 Generic data from Table 3 of the PCR Part B [2]. 2 Emissions from the heating of the bitumen, excluding combustion emissions from propane torching and the bitumen kettle. The combustion emissions are included in the dataset. The unit of VOC emissions is changed from μg/m3 to kg/100 m2 based on the functional unit due to calculation constraints.
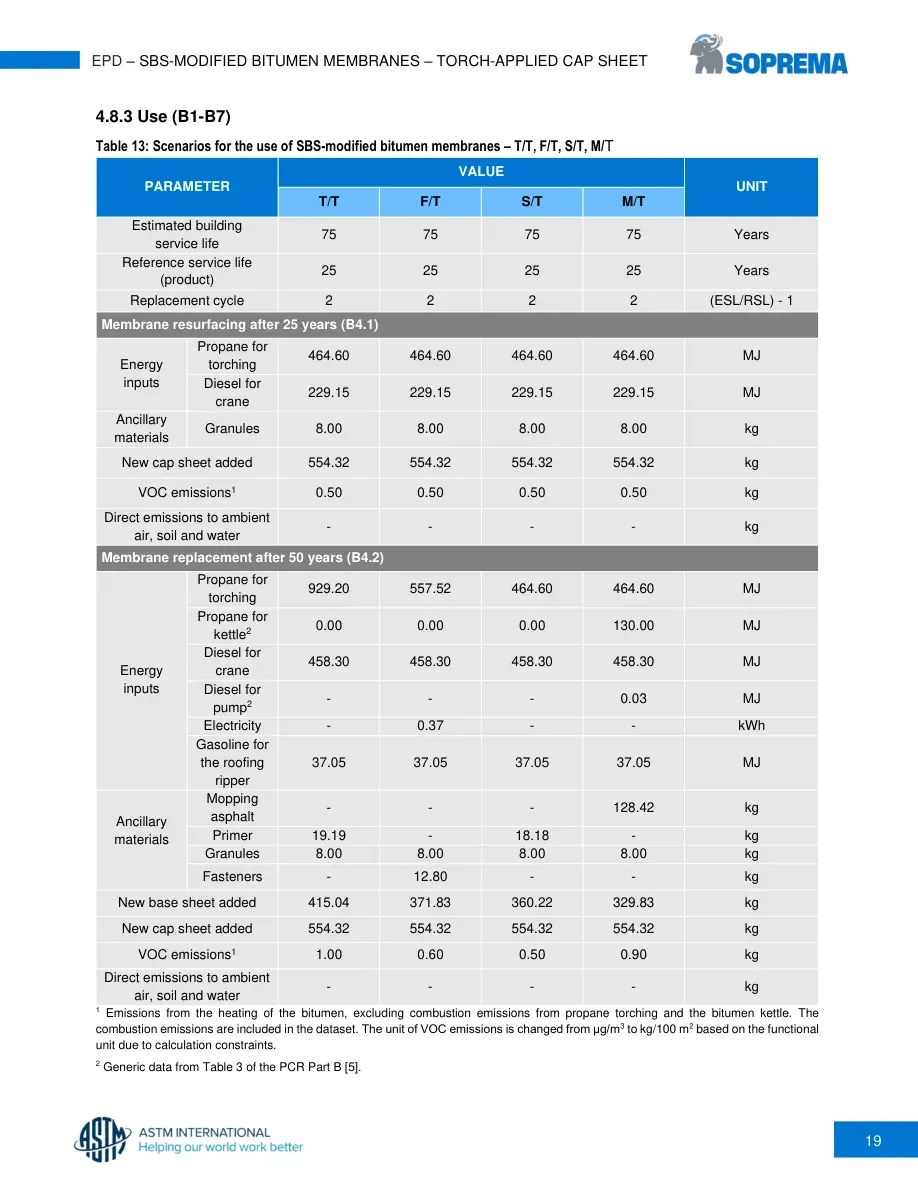
19 EPD – SBS-MODIFIED BITUMEN MEMBRANES – TORCH-APPLIED CAP SHEET 4.8.3 Use (B1-B7) Table 13: Scenarios for the use of SBS-modified bitumen membranes – T/T, F/T, S/T, M/T PARAMETER VALUE UNIT T/T F/T S/T M/T Estimated building service life 75 75 75 75 Years Reference service life (product) 25 25 25 25 Years Replacement cycle 2 2 2 2 (ESL/RSL) - 1 Membrane resurfacing after 25 years (B4.1) Energy inputs Propane for torching 464.60 464.60 464.60 464.60 MJ Diesel for crane 229.15 229.15 229.15 229.15 MJ Ancillary materials Granules 8.00 8.00 8.00 8.00 kg New cap sheet added 554.32 554.32 554.32 554.32 kg VOC emissions1 0.50 0.50 0.50 0.50 kg Direct emissions to ambient air, soil and water - - - - kg Membrane replacement after 50 years (B4.2) Energy inputs Propane for torching 929.20 557.52 464.60 464.60 MJ Propane for kettle2 0.00 0.00 0.00 130.00 MJ Diesel for crane 458.30 458.30 458.30 458.30 MJ Diesel for pump2 - - - 0.03 MJ Electricity - 0.37 - - kWh Gasoline for the roofing ripper 37.05 37.05 37.05 37.05 MJ Ancillary materials Mopping asphalt - - - 128.42 kg Primer 19.19 - 18.18 - kg Granules 8.00 8.00 8.00 8.00 kg Fasteners - 12.80 - - kg New base sheet added 415.04 371.83 360.22 329.83 kg New cap sheet added 554.32 554.32 554.32 554.32 kg VOC emissions1 1.00 0.60 0.50 0.90 kg Direct emissions to ambient air, soil and water - - - - kg 1 Emissions from the heating of the bitumen, excluding combustion emissions from propane torching and the bitumen kettle. The combustion emissions are included in the dataset. The unit of VOC emissions is changed from μg/m3 to kg/100 m2 based on the functional unit due to calculation constraints. 2 Generic data from Table 3 of the PCR Part B [5].
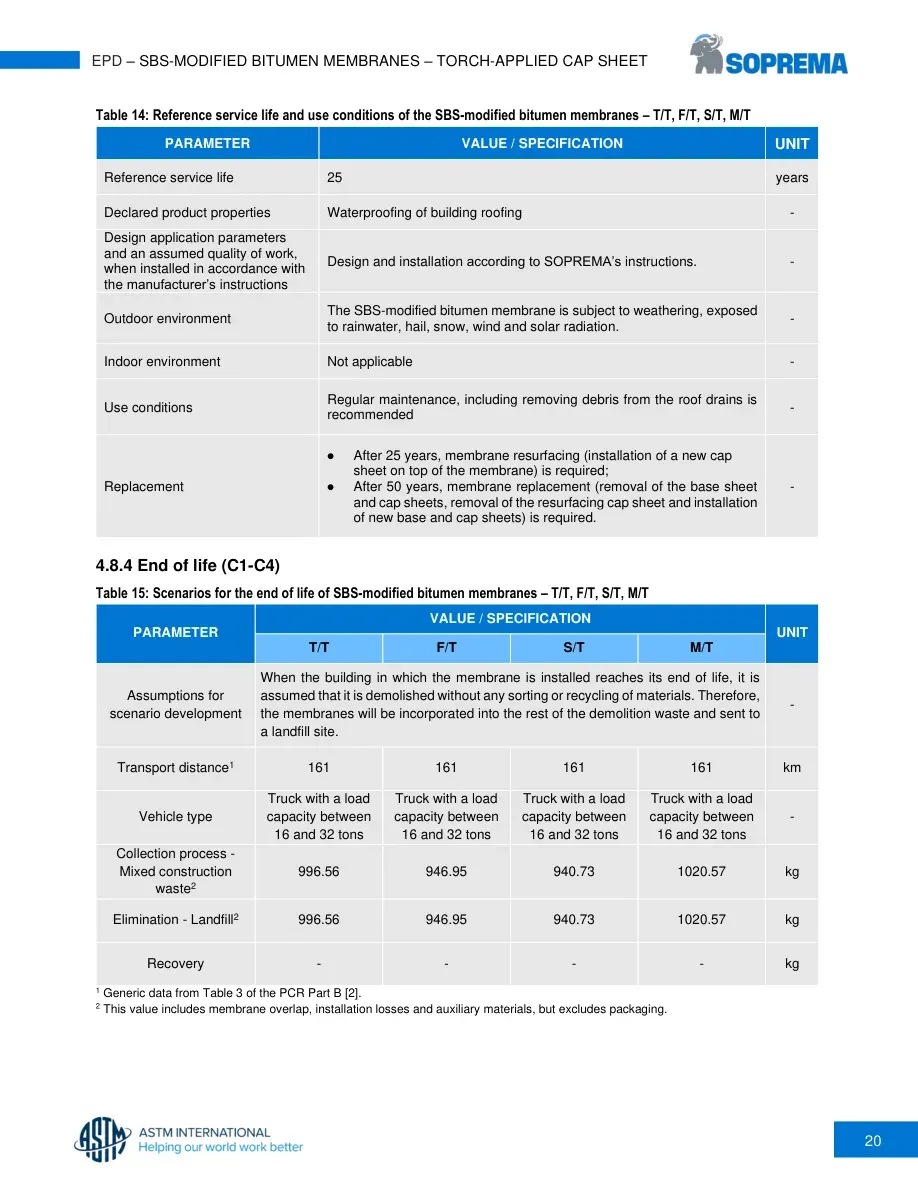
20 EPD – SBS-MODIFIED BITUMEN MEMBRANES – TORCH-APPLIED CAP SHEET Table 14: Reference service life and use conditions of the SBS-modified bitumen membranes – T/T, F/T, S/T, M/T PARAMETER VALUE / SPECIFICATION UNIT Reference service life 25 years Declared product properties Waterproofing of building roofing - Design application parameters and an assumed quality of work, when installed in accordance with the manufacturer’s instructions Design and installation according to SOPREMA’s instructions. - Outdoor environment The SBS-modified bitumen membrane is subject to weathering, exposed to rainwater, hail, snow, wind and solar radiation. - Indoor environment Not applicable - Use conditions Regular maintenance, including removing debris from the roof drains is recommended - Replacement ● After 25 years, membrane resurfacing (installation of a new cap sheet on top of the membrane) is required; ● After 50 years, membrane replacement (removal of the base sheet and cap sheets, removal of the resurfacing cap sheet and installation of new base and cap sheets) is required. - 4.8.4 End of life (C1-C4) Table 15: Scenarios for the end of life of SBS-modified bitumen membranes – T/T, F/T, S/T, M/T PARAMETER VALUE / SPECIFICATION UNIT T/T F/T S/T M/T Assumptions for scenario development When the building in which the membrane is installed reaches its end of life, it is assumed that it is demolished without any sorting or recycling of materials. Therefore, the membranes will be incorporated into the rest of the demolition waste and sent to a landfill site. - Transport distance1 161 161 161 161 km Vehicle type Truck with a load capacity between 16 and 32 tons Truck with a load capacity between 16 and 32 tons Truck with a load capacity between 16 and 32 tons Truck with a load capacity between 16 and 32 tons - Collection process - Mixed construction waste2 996.56 946.95 940.73 1020.57 kg Elimination - Landfill2 996.56 946.95 940.73 1020.57 kg Recovery - - - - kg 1 Generic data from Table 3 of the PCR Part B [2]. 2 This value includes membrane overlap, installation losses and auxiliary materials, but excludes packaging.
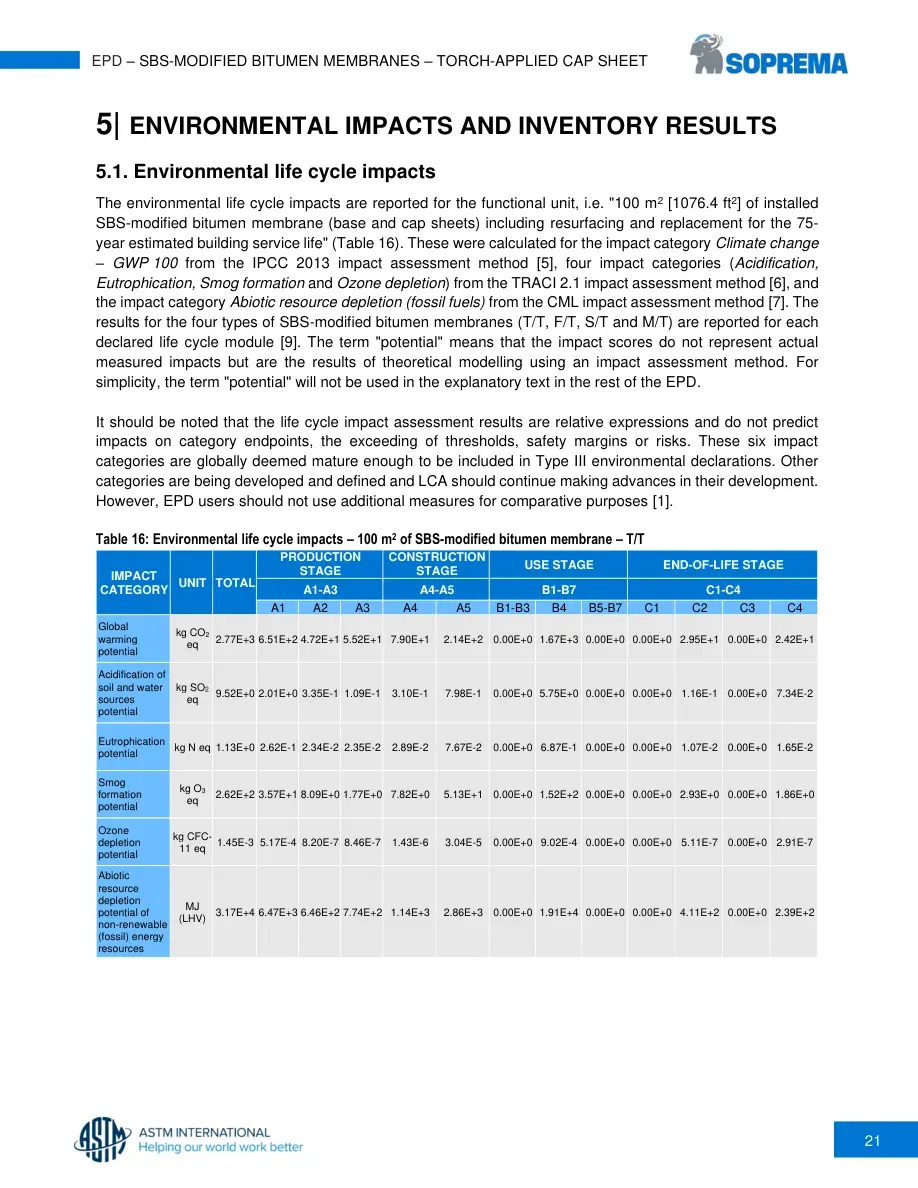
21 EPD – SBS-MODIFIED BITUMEN MEMBRANES – TORCH-APPLIED CAP SHEET 5| ENVIRONMENTAL IMPACTS AND INVENTORY RESULTS 5.1. Environmental life cycle impacts The environmental life cycle impacts are reported for the functional unit, i.e. "100 m2 [1076.4 ft2] of installed SBS-modified bitumen membrane (base and cap sheets) including resurfacing and replacement for the 75-year estimated building service life" (Table 16). These were calculated for the impact category Climate change – GWP 100 from the IPCC 2013 impact assessment method [5], four impact categories (Acidification, Eutrophication, Smog formation and Ozone depletion) from the TRACI 2.1 impact assessment method [6], and the impact category Abiotic resource depletion (fossil fuels) from the CML impact assessment method [7]. The results for the four types of SBS-modified bitumen membranes (T/T, F/T, S/T and M/T) are reported for each declared life cycle module [9]. The term "potential" means that the impact scores do not represent actual measured impacts but are the results of theoretical modelling using an impact assessment method. For simplicity, the term "potential" will not be used in the explanatory text in the rest of the EPD. It should be noted that the life cycle impact assessment results are relative expressions and do not predict impacts on category endpoints, the exceeding of thresholds, safety margins or risks. These six impact categories are globally deemed mature enough to be included in Type III environmental declarations. Other categories are being developed and defined and LCA should continue making advances in their development. However, EPD users should not use additional measures for comparative purposes [1]. Table 16: Environmental life cycle impacts – 100 m2 of SBS-modified bitumen membrane – T/T IMPACT CATEGORY UNIT TOTAL PRODUCTION STAGE CONSTRUCTION STAGE USE STAGE END-OF-LIFE STAGE A1-A3 A4-A5 B1-B7 C1-C4 A1 A2 A3 A4 A5 B1-B3 B4 B5-B7 C1 C2 C3 C4 Global warming potential kg CO2 eq 2.77E+3 6.51E+2 4.72E+1 5.52E+1 7.90E+1 2.14E+2 0.00E+0 1.67E+3 0.00E+0 0.00E+0 2.95E+1 0.00E+0 2.42E+1 Acidification of soil and water sources potential kg SO2 eq 9.52E+0 2.01E+0 3.35E-1 1.09E-1 3.10E-1 7.98E-1 0.00E+0 5.75E+0 0.00E+0 0.00E+0 1.16E-1 0.00E+0 7.34E-2 Eutrophication potential kg N eq 1.13E+0 2.62E-1 2.34E-2 2.35E-2 2.89E-2 7.67E-2 0.00E+0 6.87E-1 0.00E+0 0.00E+0 1.07E-2 0.00E+0 1.65E-2 Smog formation potential kg O3 eq 2.62E+2 3.57E+1 8.09E+0 1.77E+0 7.82E+0 5.13E+1 0.00E+0 1.52E+2 0.00E+0 0.00E+0 2.93E+0 0.00E+0 1.86E+0 Ozone depletion potential kg CFC-11 eq 1.45E-3 5.17E-4 8.20E-7 8.46E-7 1.43E-6 3.04E-5 0.00E+0 9.02E-4 0.00E+0 0.00E+0 5.11E-7 0.00E+0 2.91E-7 Abiotic resource depletion potential of non-renewable (fossil) energy resources MJ (LHV) 3.17E+4 6.47E+3 6.46E+2 7.74E+2 1.14E+3 2.86E+3 0.00E+0 1.91E+4 0.00E+0 0.00E+0 4.11E+2 0.00E+0 2.39E+2
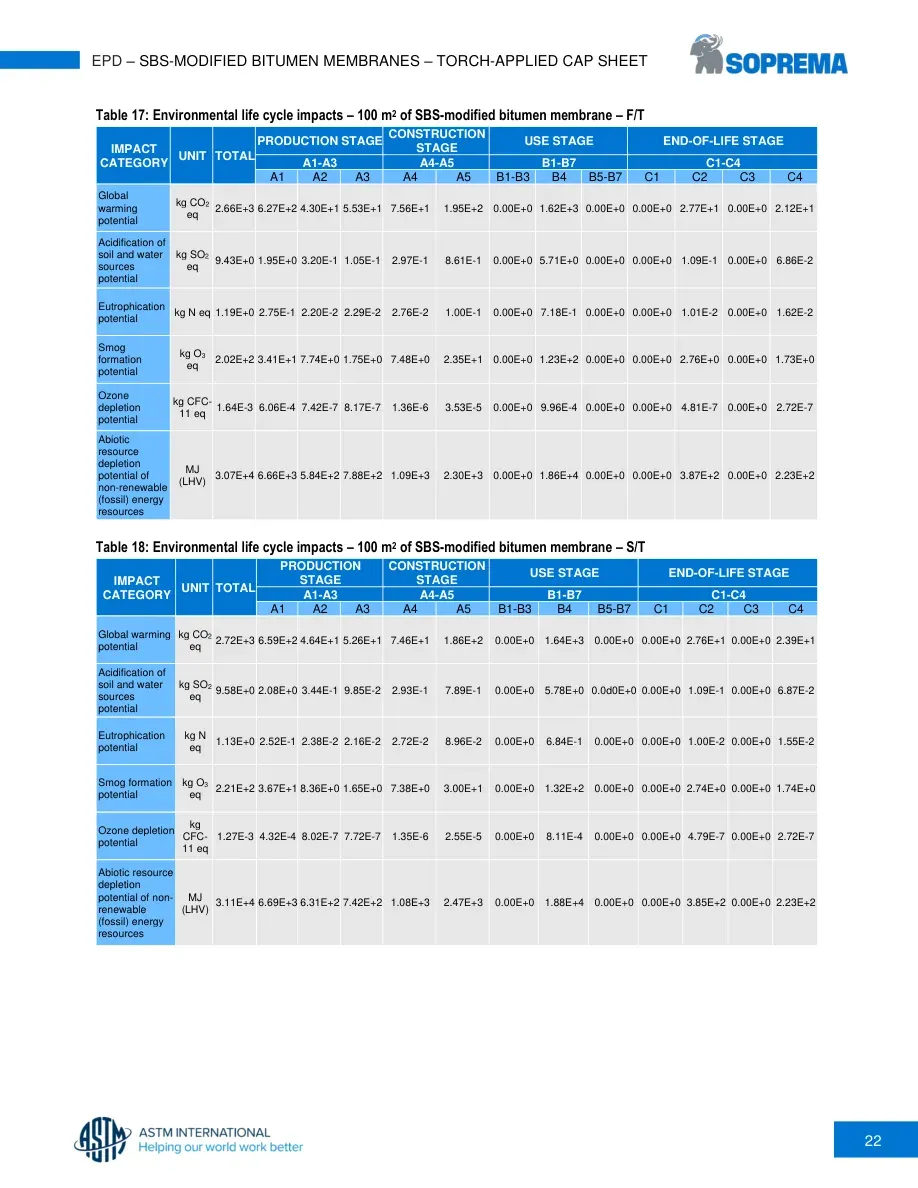
22 EPD – SBS-MODIFIED BITUMEN MEMBRANES – TORCH-APPLIED CAP SHEET Table 17: Environmental life cycle impacts – 100 m2 of SBS-modified bitumen membrane – F/T IMPACT CATEGORY UNIT TOTAL PRODUCTION STAGE CONSTRUCTION STAGE USE STAGE END-OF-LIFE STAGE A1-A3 A4-A5 B1-B7 C1-C4 A1 A2 A3 A4 A5 B1-B3 B4 B5-B7 C1 C2 C3 C4 Global warming potential kg CO2 eq 2.66E+3 6.27E+2 4.30E+1 5.53E+1 7.56E+1 1.95E+2 0.00E+0 1.62E+3 0.00E+0 0.00E+0 2.77E+1 0.00E+0 2.12E+1 Acidification of soil and water sources potential kg SO2 eq 9.43E+0 1.95E+0 3.20E-1 1.05E-1 2.97E-1 8.61E-1 0.00E+0 5.71E+0 0.00E+0 0.00E+0 1.09E-1 0.00E+0 6.86E-2 Eutrophication potential kg N eq 1.19E+0 2.75E-1 2.20E-2 2.29E-2 2.76E-2 1.00E-1 0.00E+0 7.18E-1 0.00E+0 0.00E+0 1.01E-2 0.00E+0 1.62E-2 Smog formation potential kg O3 eq 2.02E+2 3.41E+1 7.74E+0 1.75E+0 7.48E+0 2.35E+1 0.00E+0 1.23E+2 0.00E+0 0.00E+0 2.76E+0 0.00E+0 1.73E+0 Ozone depletion potential kg CFC-11 eq 1.64E-3 6.06E-4 7.42E-7 8.17E-7 1.36E-6 3.53E-5 0.00E+0 9.96E-4 0.00E+0 0.00E+0 4.81E-7 0.00E+0 2.72E-7 Abiotic resource depletion potential of non-renewable (fossil) energy resources MJ (LHV) 3.07E+4 6.66E+3 5.84E+2 7.88E+2 1.09E+3 2.30E+3 0.00E+0 1.86E+4 0.00E+0 0.00E+0 3.87E+2 0.00E+0 2.23E+2 Table 18: Environmental life cycle impacts – 100 m2 of SBS-modified bitumen membrane – S/T IMPACT CATEGORY UNIT TOTAL PRODUCTION STAGE CONSTRUCTION STAGE USE STAGE END-OF-LIFE STAGE A1-A3 A4-A5 B1-B7 C1-C4 A1 A2 A3 A4 A5 B1-B3 B4 B5-B7 C1 C2 C3 C4 Global warming potential kg CO2 eq 2.72E+3 6.59E+2 4.64E+1 5.26E+1 7.46E+1 1.86E+2 0.00E+0 1.64E+3 0.00E+0 0.00E+0 2.76E+1 0.00E+0 2.39E+1 Acidification of soil and water sources potential kg SO2 eq 9.58E+0 2.08E+0 3.44E-1 9.85E-2 2.93E-1 7.89E-1 0.00E+0 5.78E+0 0.0d0E+0 0.00E+0 1.09E-1 0.00E+0 6.87E-2 Eutrophication potential kg N eq 1.13E+0 2.52E-1 2.38E-2 2.16E-2 2.72E-2 8.96E-2 0.00E+0 6.84E-1 0.00E+0 0.00E+0 1.00E-2 0.00E+0 1.55E-2 Smog formation potential kg O3 eq 2.21E+2 3.67E+1 8.36E+0 1.65E+0 7.38E+0 3.00E+1 0.00E+0 1.32E+2 0.00E+0 0.00E+0 2.74E+0 0.00E+0 1.74E+0 Ozone depletion potential kg CFC-11 eq 1.27E-3 4.32E-4 8.02E-7 7.72E-7 1.35E-6 2.55E-5 0.00E+0 8.11E-4 0.00E+0 0.00E+0 4.79E-7 0.00E+0 2.72E-7 Abiotic resource depletion potential of non-renewable (fossil) energy resources MJ (LHV) 3.11E+4 6.69E+3 6.31E+2 7.42E+2 1.08E+3 2.47E+3 0.00E+0 1.88E+4 0.00E+0 0.00E+0 3.85E+2 0.00E+0 2.23E+2
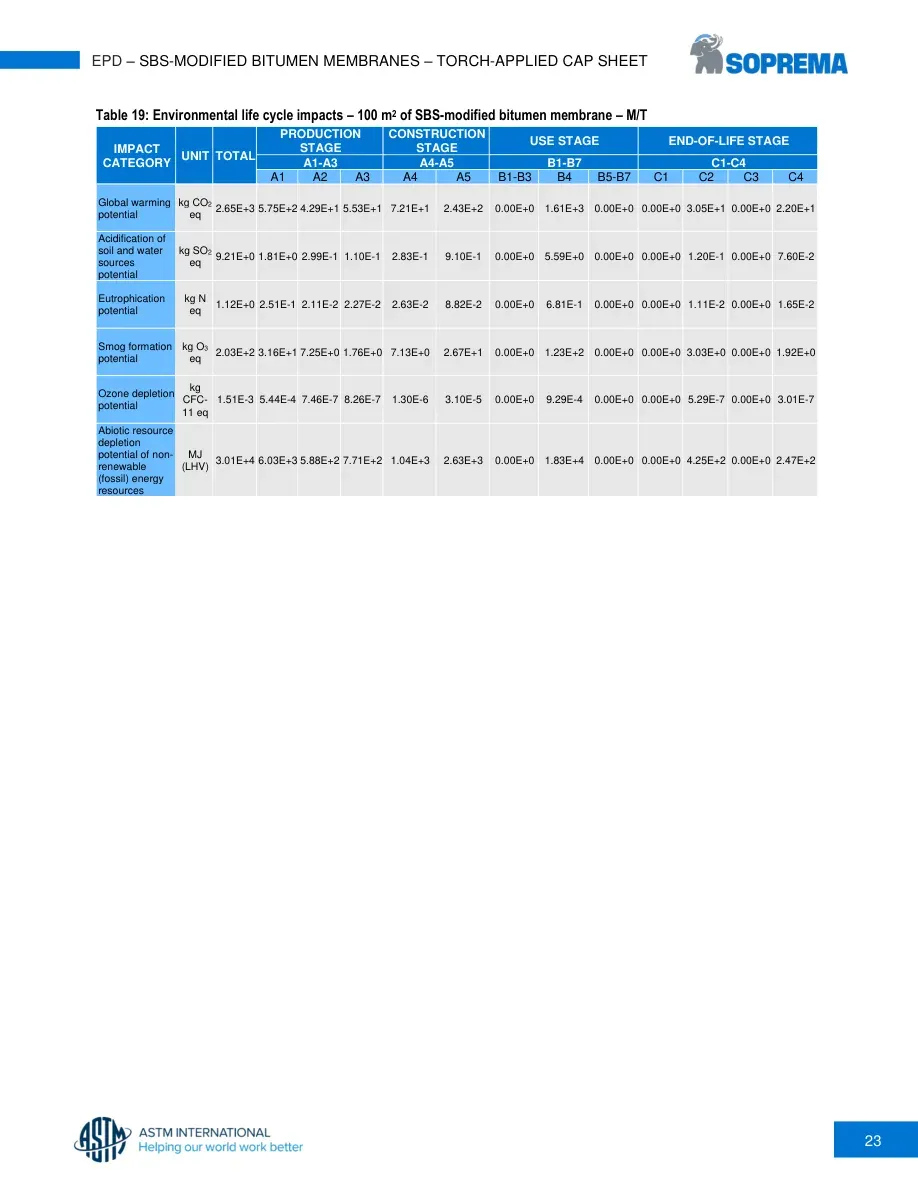
23 EPD – SBS-MODIFIED BITUMEN MEMBRANES – TORCH-APPLIED CAP SHEET Table 19: Environmental life cycle impacts – 100 m2 of SBS-modified bitumen membrane – M/T IMPACT CATEGORY UNIT TOTAL PRODUCTION STAGE CONSTRUCTION STAGE USE STAGE END-OF-LIFE STAGE A1-A3 A4-A5 B1-B7 C1-C4 A1 A2 A3 A4 A5 B1-B3 B4 B5-B7 C1 C2 C3 C4 Global warming potential kg CO2 eq 2.65E+3 5.75E+2 4.29E+1 5.53E+1 7.21E+1 2.43E+2 0.00E+0 1.61E+3 0.00E+0 0.00E+0 3.05E+1 0.00E+0 2.20E+1 Acidification of soil and water sources potential kg SO2 eq 9.21E+0 1.81E+0 2.99E-1 1.10E-1 2.83E-1 9.10E-1 0.00E+0 5.59E+0 0.00E+0 0.00E+0 1.20E-1 0.00E+0 7.60E-2 Eutrophication potential kg N eq 1.12E+0 2.51E-1 2.11E-2 2.27E-2 2.63E-2 8.82E-2 0.00E+0 6.81E-1 0.00E+0 0.00E+0 1.11E-2 0.00E+0 1.65E-2 Smog formation potential kg O3 eq 2.03E+2 3.16E+1 7.25E+0 1.76E+0 7.13E+0 2.67E+1 0.00E+0 1.23E+2 0.00E+0 0.00E+0 3.03E+0 0.00E+0 1.92E+0 Ozone depletion potential kg CFC-11 eq 1.51E-3 5.44E-4 7.46E-7 8.26E-7 1.30E-6 3.10E-5 0.00E+0 9.29E-4 0.00E+0 0.00E+0 5.29E-7 0.00E+0 3.01E-7 Abiotic resource depletion potential of non-renewable (fossil) energy resources MJ (LHV) 3.01E+4 6.03E+3 5.88E+2 7.71E+2 1.04E+3 2.63E+3 0.00E+0 1.83E+4 0.00E+0 0.00E+0 4.25E+2 0.00E+0 2.47E+2
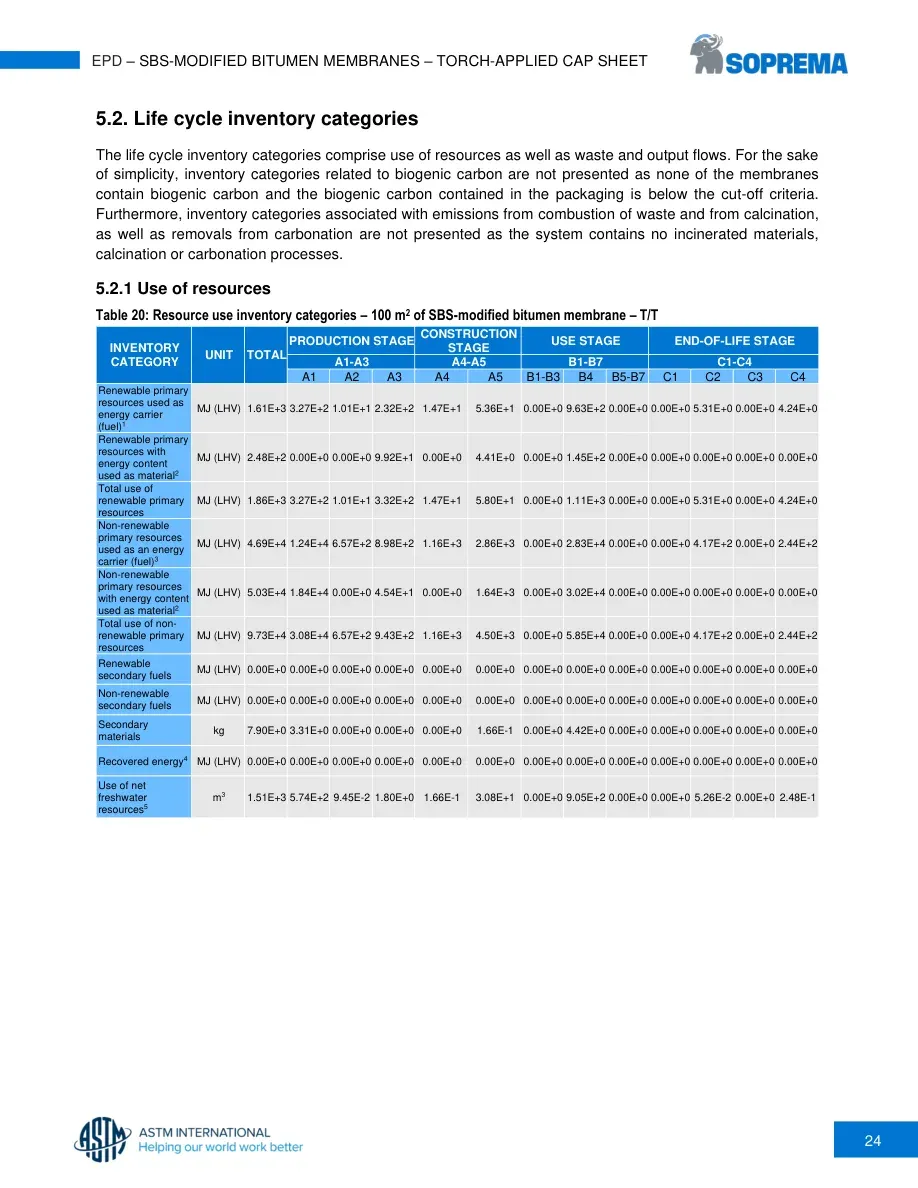
24 EPD – SBS-MODIFIED BITUMEN MEMBRANES – TORCH-APPLIED CAP SHEET 5.2. Life cycle inventory categories The life cycle inventory categories comprise use of resources as well as waste and output flows. For the sake of simplicity, inventory categories related to biogenic carbon are not presented as none of the membranes contain biogenic carbon and the biogenic carbon contained in the packaging is below the cut-off criteria. Furthermore, inventory categories associated with emissions from combustion of waste and from calcination, as well as removals from carbonation are not presented as the system contains no incinerated materials, calcination or carbonation processes. 5.2.1 Use of resources Table 20: Resource use inventory categories – 100 m2 of SBS-modified bitumen membrane – T/T INVENTORY CATEGORY UNIT TOTAL PRODUCTION STAGE CONSTRUCTION STAGE USE STAGE END-OF-LIFE STAGE A1-A3 A4-A5 B1-B7 C1-C4 A1 A2 A3 A4 A5 B1-B3 B4 B5-B7 C1 C2 C3 C4 Renewable primary resources used as energy carrier (fuel)1 MJ (LHV) 1.61E+3 3.27E+2 1.01E+1 2.32E+2 1.47E+1 5.36E+1 0.00E+0 9.63E+2 0.00E+0 0.00E+0 5.31E+0 0.00E+0 4.24E+0 Renewable primary resources with energy content used as material2 MJ (LHV) 2.48E+2 0.00E+0 0.00E+0 9.92E+1 0.00E+0 4.41E+0 0.00E+0 1.45E+2 0.00E+0 0.00E+0 0.00E+0 0.00E+0 0.00E+0 Total use of renewable primary resources MJ (LHV) 1.86E+3 3.27E+2 1.01E+1 3.32E+2 1.47E+1 5.80E+1 0.00E+0 1.11E+3 0.00E+0 0.00E+0 5.31E+0 0.00E+0 4.24E+0 Non-renewable primary resources used as an energy carrier (fuel)3 MJ (LHV) 4.69E+4 1.24E+4 6.57E+2 8.98E+2 1.16E+3 2.86E+3 0.00E+0 2.83E+4 0.00E+0 0.00E+0 4.17E+2 0.00E+0 2.44E+2 Non-renewable primary resources with energy content used as material2 MJ (LHV) 5.03E+4 1.84E+4 0.00E+0 4.54E+1 0.00E+0 1.64E+3 0.00E+0 3.02E+4 0.00E+0 0.00E+0 0.00E+0 0.00E+0 0.00E+0 Total use of non-renewable primary resources MJ (LHV) 9.73E+4 3.08E+4 6.57E+2 9.43E+2 1.16E+3 4.50E+3 0.00E+0 5.85E+4 0.00E+0 0.00E+0 4.17E+2 0.00E+0 2.44E+2 Renewable secondary fuels MJ (LHV) 0.00E+0 0.00E+0 0.00E+0 0.00E+0 0.00E+0 0.00E+0 0.00E+0 0.00E+0 0.00E+0 0.00E+0 0.00E+0 0.00E+0 0.00E+0 Non-renewable secondary fuels MJ (LHV) 0.00E+0 0.00E+0 0.00E+0 0.00E+0 0.00E+0 0.00E+0 0.00E+0 0.00E+0 0.00E+0 0.00E+0 0.00E+0 0.00E+0 0.00E+0 Secondary materials kg 7.90E+0 3.31E+0 0.00E+0 0.00E+0 0.00E+0 1.66E-1 0.00E+0 4.42E+0 0.00E+0 0.00E+0 0.00E+0 0.00E+0 0.00E+0 Recovered energy4 MJ (LHV) 0.00E+0 0.00E+0 0.00E+0 0.00E+0 0.00E+0 0.00E+0 0.00E+0 0.00E+0 0.00E+0 0.00E+0 0.00E+0 0.00E+0 0.00E+0 Use of net freshwater resources5 m3 1.51E+3 5.74E+2 9.45E-2 1.80E+0 1.66E-1 3.08E+1 0.00E+0 9.05E+2 0.00E+0 0.00E+0 5.26E-2 0.00E+0 2.48E-1

25 EPD – SBS-MODIFIED BITUMEN MEMBRANES – TORCH-APPLIED CAP SHEET Table 21: Resource use inventory categories – 100 m2 of SBS-modified bitumen membrane – F/T INVENTORY CATEGORY UNIT TOTAL PRODUCTION STAGE CONSTRUCTION STAGE USE STAGE END-OF-LIFE STAGE A1-A3 A4-A5 B1-B7 C1-C4 A1 A2 A3 A4 A5 B1-B3 B4 B5-B7 C1 C2 C3 C4 Renewable primary resources used as energy carrier (fuel)1 MJ (LHV) 1.74E+3 3.26E+2 9.39E+0 2.68E+2 1.40E+1 8.82E+1 0.00E+0 1.03E+3 0.00E+0 0.00E+0 4.99E+0 0.00E+0 3.95E+0 Renewable primary resources with energy content used as material2 MJ (LHV) 2.42E+2 0.00E+0 0.00E+0 9.58E+1 0.00E+0 4.18E+0 0.00E+0 1.42E+2 0.00E+0 0.00E+0 0.00E+0 0.00E+0 0.00E+0 Total use of renewable primary resources MJ (LHV) 1.98E+3 3.26E+2 9.39E+0 3.64E+2 1.40E+1 9.24E+1 0.00E+0 1.17E+3 0.00E+0 0.00E+0 4.99E+0 0.00E+0 3.95E+0 Non-renewable primary resources used as an energy carrier (fuel)3 MJ (LHV) 4.46E+4 1.19E+4 5.94E+2 7.61E+2 1.11E+3 2.49E+3 0.00E+0 2.71E+4 0.00E+0 0.00E+0 3.92E+2 0.00E+0 2.28E+2 Non-renewable primary resources with energy content used as material2 MJ (LHV) 4.61E+4 1.71E+4 0.00E+0 4.99E+1 0.00E+0 8.56E+2 0.00E+0 2.81E+4 0.00E+0 0.00E+0 0.00E+0 0.00E+0 0.00E+0 Total use of non-renewable primary resources MJ (LHV) 9.06E+4 2.89E+4 5.94E+2 8.11E+2 1.11E+3 3.35E+3 0.00E+0 5.52E+4 0.00E+0 0.00E+0 3.92E+2 0.00E+0 2.28E+2 Renewable secondary fuels MJ (LHV) 0.00E+0 0.00E+0 0.00E+0 0.00E+0 0.00E+0 0.00E+0 0.00E+0 0.00E+0 0.00E+0 0.00E+0 0.00E+0 0.00E+0 0.00E+0 Non-renewable secondary fuels MJ (LHV) 0.00E+0 0.00E+0 0.00E+0 0.00E+0 0.00E+0 0.00E+0 0.00E+0 0.00E+0 0.00E+0 0.00E+0 0.00E+0 0.00E+0 0.00E+0 Secondary materials kg 4.28E+0 1.59E+0 0.00E+0 0.00E+0 0.00E+0 7.95E-2 0.00E+0 2.61E+0 0.00E+0 0.00E+0 0.00E+0 0.00E+0 0.00E+0 Recovered energy4 MJ (LHV) 0.00E+0 0.00E+0 0.00E+0 0.00E+0 0.00E+0 0.00E+0 0.00E+0 0.00E+0 0.00E+0 0.00E+0 0.00E+0 0.00E+0 0.00E+0 Use of net freshwater resources5 m3 1.38E+3 5.11E+2 8.58E-2 1.77E+0 1.58E-1 2.75E+1 0.00E+0 8.38E+2 0.00E+0 0.00E+0 4.95E-2 0.00E+0 2.32E-1
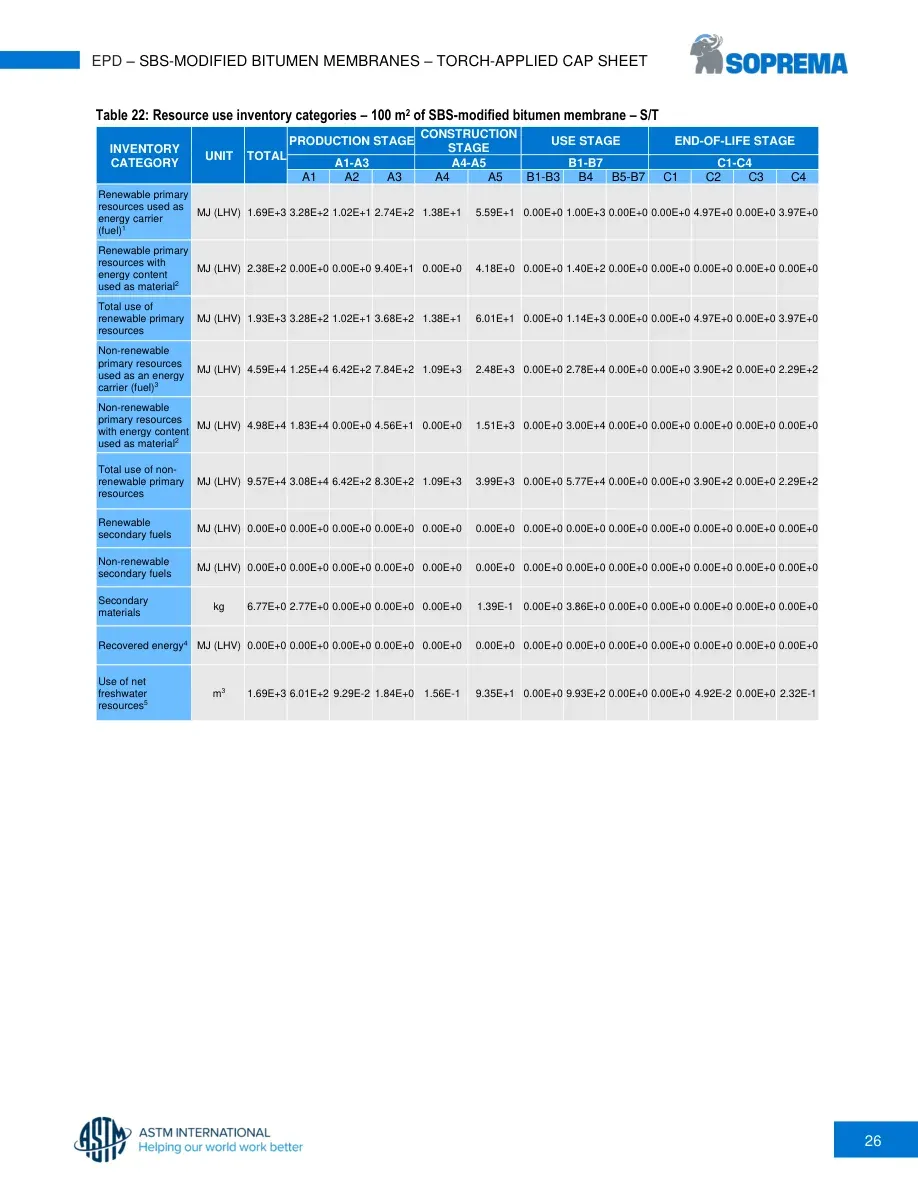
26 EPD – SBS-MODIFIED BITUMEN MEMBRANES – TORCH-APPLIED CAP SHEET Table 22: Resource use inventory categories – 100 m2 of SBS-modified bitumen membrane – S/T INVENTORY CATEGORY UNIT TOTAL PRODUCTION STAGE CONSTRUCTION STAGE USE STAGE END-OF-LIFE STAGE A1-A3 A4-A5 B1-B7 C1-C4 A1 A2 A3 A4 A5 B1-B3 B4 B5-B7 C1 C2 C3 C4 Renewable primary resources used as energy carrier (fuel)1 MJ (LHV) 1.69E+3 3.28E+2 1.02E+1 2.74E+2 1.38E+1 5.59E+1 0.00E+0 1.00E+3 0.00E+0 0.00E+0 4.97E+0 0.00E+0 3.97E+0 Renewable primary resources with energy content used as material2 MJ (LHV) 2.38E+2 0.00E+0 0.00E+0 9.40E+1 0.00E+0 4.18E+0 0.00E+0 1.40E+2 0.00E+0 0.00E+0 0.00E+0 0.00E+0 0.00E+0 Total use of renewable primary resources MJ (LHV) 1.93E+3 3.28E+2 1.02E+1 3.68E+2 1.38E+1 6.01E+1 0.00E+0 1.14E+3 0.00E+0 0.00E+0 4.97E+0 0.00E+0 3.97E+0 Non-renewable primary resources used as an energy carrier (fuel)3 MJ (LHV) 4.59E+4 1.25E+4 6.42E+2 7.84E+2 1.09E+3 2.48E+3 0.00E+0 2.78E+4 0.00E+0 0.00E+0 3.90E+2 0.00E+0 2.29E+2 Non-renewable primary resources with energy content used as material2 MJ (LHV) 4.98E+4 1.83E+4 0.00E+0 4.56E+1 0.00E+0 1.51E+3 0.00E+0 3.00E+4 0.00E+0 0.00E+0 0.00E+0 0.00E+0 0.00E+0 Total use of non-renewable primary resources MJ (LHV) 9.57E+4 3.08E+4 6.42E+2 8.30E+2 1.09E+3 3.99E+3 0.00E+0 5.77E+4 0.00E+0 0.00E+0 3.90E+2 0.00E+0 2.29E+2 Renewable secondary fuels MJ (LHV) 0.00E+0 0.00E+0 0.00E+0 0.00E+0 0.00E+0 0.00E+0 0.00E+0 0.00E+0 0.00E+0 0.00E+0 0.00E+0 0.00E+0 0.00E+0 Non-renewable secondary fuels MJ (LHV) 0.00E+0 0.00E+0 0.00E+0 0.00E+0 0.00E+0 0.00E+0 0.00E+0 0.00E+0 0.00E+0 0.00E+0 0.00E+0 0.00E+0 0.00E+0 Secondary materials kg 6.77E+0 2.77E+0 0.00E+0 0.00E+0 0.00E+0 1.39E-1 0.00E+0 3.86E+0 0.00E+0 0.00E+0 0.00E+0 0.00E+0 0.00E+0 Recovered energy4 MJ (LHV) 0.00E+0 0.00E+0 0.00E+0 0.00E+0 0.00E+0 0.00E+0 0.00E+0 0.00E+0 0.00E+0 0.00E+0 0.00E+0 0.00E+0 0.00E+0 Use of net freshwater resources5 m3 1.69E+3 6.01E+2 9.29E-2 1.84E+0 1.56E-1 9.35E+1 0.00E+0 9.93E+2 0.00E+0 0.00E+0 4.92E-2 0.00E+0 2.32E-1
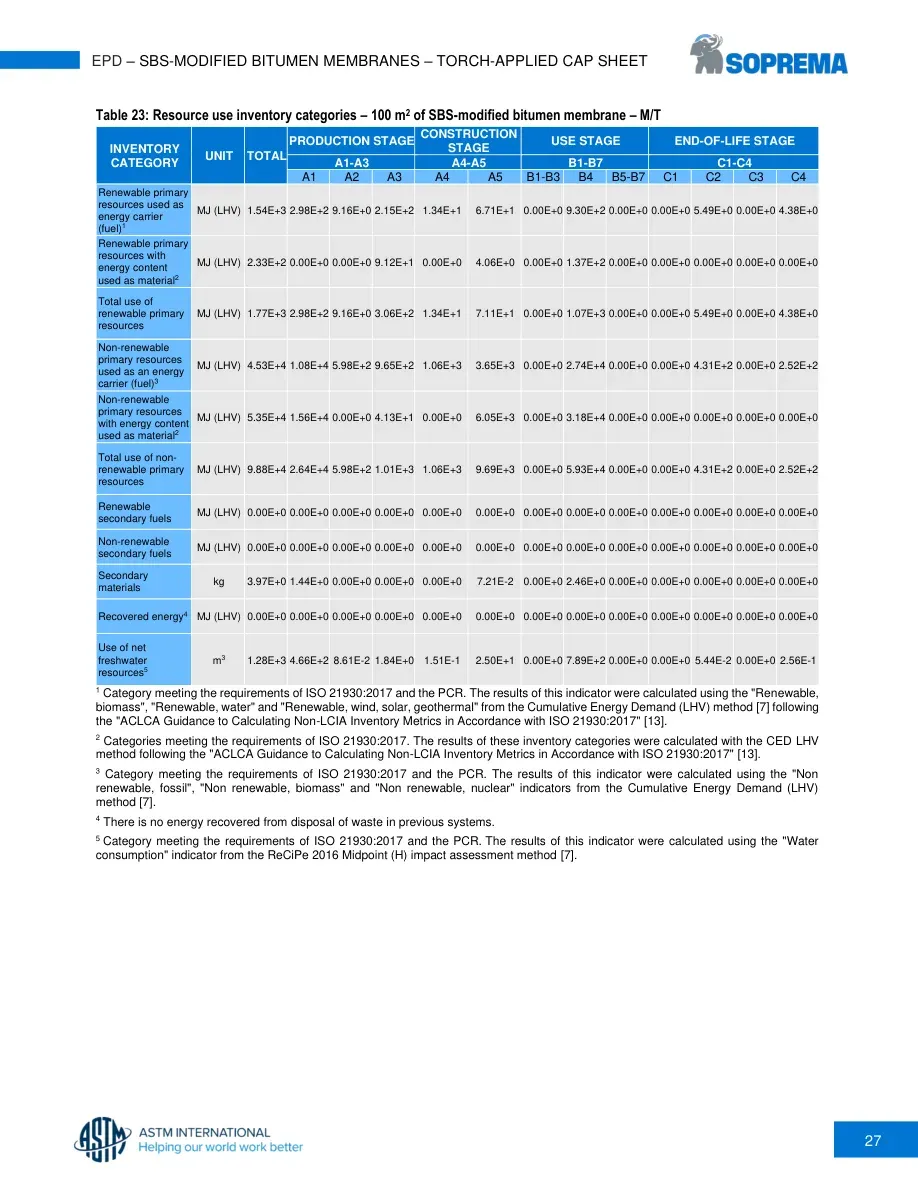
27 EPD – SBS-MODIFIED BITUMEN MEMBRANES – TORCH-APPLIED CAP SHEET Table 23: Resource use inventory categories – 100 m2 of SBS-modified bitumen membrane – M/T INVENTORY CATEGORY UNIT TOTAL PRODUCTION STAGE CONSTRUCTION STAGE USE STAGE END-OF-LIFE STAGE A1-A3 A4-A5 B1-B7 C1-C4 A1 A2 A3 A4 A5 B1-B3 B4 B5-B7 C1 C2 C3 C4 Renewable primary resources used as energy carrier (fuel)1 MJ (LHV) 1.54E+3 2.98E+2 9.16E+0 2.15E+2 1.34E+1 6.71E+1 0.00E+0 9.30E+2 0.00E+0 0.00E+0 5.49E+0 0.00E+0 4.38E+0 Renewable primary resources with energy content used as material2 MJ (LHV) 2.33E+2 0.00E+0 0.00E+0 9.12E+1 0.00E+0 4.06E+0 0.00E+0 1.37E+2 0.00E+0 0.00E+0 0.00E+0 0.00E+0 0.00E+0 Total use of renewable primary resources MJ (LHV) 1.77E+3 2.98E+2 9.16E+0 3.06E+2 1.34E+1 7.11E+1 0.00E+0 1.07E+3 0.00E+0 0.00E+0 5.49E+0 0.00E+0 4.38E+0 Non-renewable primary resources used as an energy carrier (fuel)3 MJ (LHV) 4.53E+4 1.08E+4 5.98E+2 9.65E+2 1.06E+3 3.65E+3 0.00E+0 2.74E+4 0.00E+0 0.00E+0 4.31E+2 0.00E+0 2.52E+2 Non-renewable primary resources with energy content used as material2 MJ (LHV) 5.35E+4 1.56E+4 0.00E+0 4.13E+1 0.00E+0 6.05E+3 0.00E+0 3.18E+4 0.00E+0 0.00E+0 0.00E+0 0.00E+0 0.00E+0 Total use of non-renewable primary resources MJ (LHV) 9.88E+4 2.64E+4 5.98E+2 1.01E+3 1.06E+3 9.69E+3 0.00E+0 5.93E+4 0.00E+0 0.00E+0 4.31E+2 0.00E+0 2.52E+2 Renewable secondary fuels MJ (LHV) 0.00E+0 0.00E+0 0.00E+0 0.00E+0 0.00E+0 0.00E+0 0.00E+0 0.00E+0 0.00E+0 0.00E+0 0.00E+0 0.00E+0 0.00E+0 Non-renewable secondary fuels MJ (LHV) 0.00E+0 0.00E+0 0.00E+0 0.00E+0 0.00E+0 0.00E+0 0.00E+0 0.00E+0 0.00E+0 0.00E+0 0.00E+0 0.00E+0 0.00E+0 Secondary materials kg 3.97E+0 1.44E+0 0.00E+0 0.00E+0 0.00E+0 7.21E-2 0.00E+0 2.46E+0 0.00E+0 0.00E+0 0.00E+0 0.00E+0 0.00E+0 Recovered energy4 MJ (LHV) 0.00E+0 0.00E+0 0.00E+0 0.00E+0 0.00E+0 0.00E+0 0.00E+0 0.00E+0 0.00E+0 0.00E+0 0.00E+0 0.00E+0 0.00E+0 Use of net freshwater resources5 m3 1.28E+3 4.66E+2 8.61E-2 1.84E+0 1.51E-1 2.50E+1 0.00E+0 7.89E+2 0.00E+0 0.00E+0 5.44E-2 0.00E+0 2.56E-1 1 Category meeting the requirements of ISO 21930:2017 and the PCR. The results of this indicator were calculated using the "Renewable, biomass", "Renewable, water" and "Renewable, wind, solar, geothermal" from the Cumulative Energy Demand (LHV) method [7] following the "ACLCA Guidance to Calculating Non-LCIA Inventory Metrics in Accordance with ISO 21930:2017" [13]. 2 Categories meeting the requirements of ISO 21930:2017. The results of these inventory categories were calculated with the CED LHV method following the "ACLCA Guidance to Calculating Non-LCIA Inventory Metrics in Accordance with ISO 21930:2017" [13]. 3 Category meeting the requirements of ISO 21930:2017 and the PCR. The results of this indicator were calculated using the "Non renewable, fossil", "Non renewable, biomass" and "Non renewable, nuclear" indicators from the Cumulative Energy Demand (LHV) method [7]. 4 There is no energy recovered from disposal of waste in previous systems. 5 Category meeting the requirements of ISO 21930:2017 and the PCR. The results of this indicator were calculated using the "Water consumption" indicator from the ReCiPe 2016 Midpoint (H) impact assessment method [7].
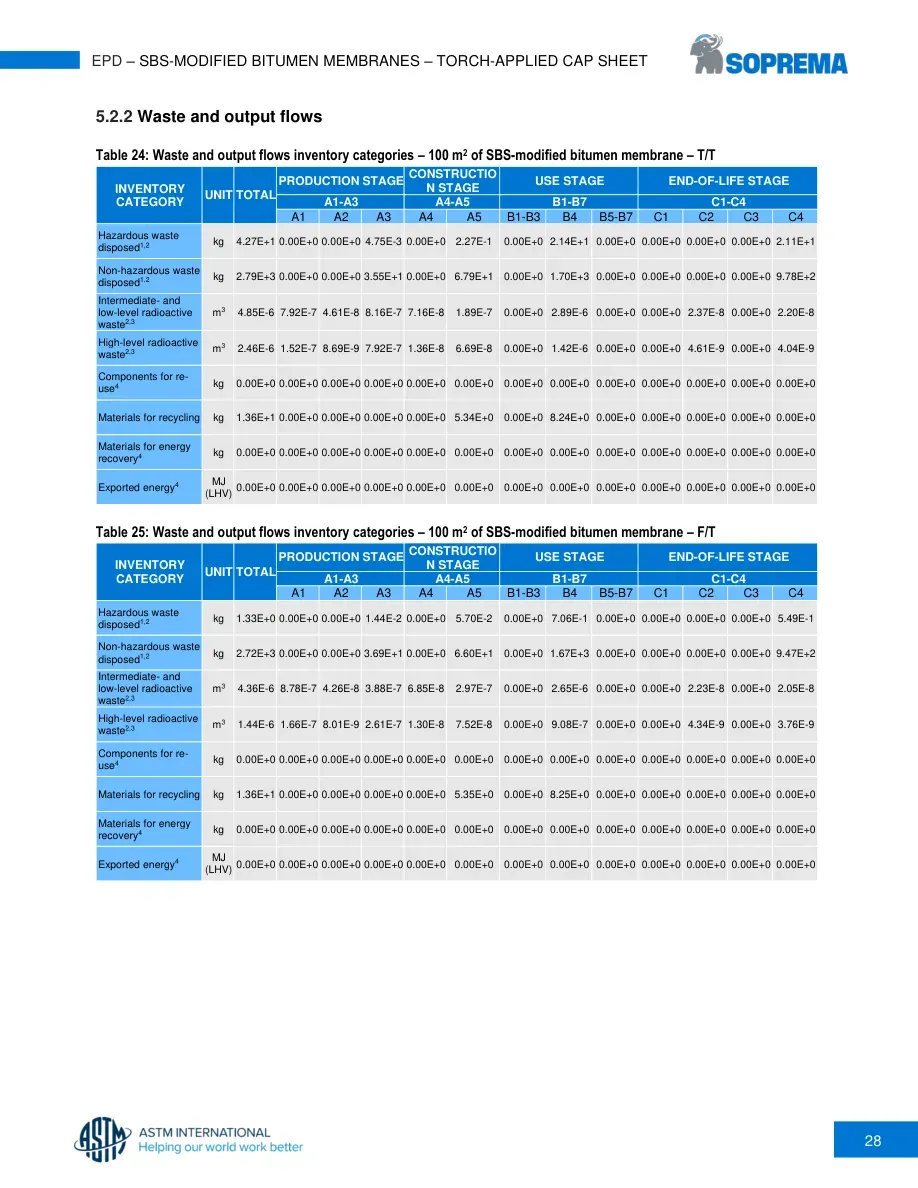
28 EPD – SBS-MODIFIED BITUMEN MEMBRANES – TORCH-APPLIED CAP SHEET 5.2.2 Waste and output flows Table 24: Waste and output flows inventory categories – 100 m2 of SBS-modified bitumen membrane – T/T INVENTORY CATEGORY UNIT TOTAL PRODUCTION STAGE CONSTRUCTION STAGE USE STAGE END-OF-LIFE STAGE A1-A3 A4-A5 B1-B7 C1-C4 A1 A2 A3 A4 A5 B1-B3 B4 B5-B7 C1 C2 C3 C4 Hazardous waste disposed1,2 kg 4.27E+1 0.00E+0 0.00E+0 4.75E-3 0.00E+0 2.27E-1 0.00E+0 2.14E+1 0.00E+0 0.00E+0 0.00E+0 0.00E+0 2.11E+1 Non-hazardous waste disposed1,2 kg 2.79E+3 0.00E+0 0.00E+0 3.55E+1 0.00E+0 6.79E+1 0.00E+0 1.70E+3 0.00E+0 0.00E+0 0.00E+0 0.00E+0 9.78E+2 Intermediate- and low-level radioactive waste2,3 m3 4.85E-6 7.92E-7 4.61E-8 8.16E-7 7.16E-8 1.89E-7 0.00E+0 2.89E-6 0.00E+0 0.00E+0 2.37E-8 0.00E+0 2.20E-8 High-level radioactive waste2,3 m3 2.46E-6 1.52E-7 8.69E-9 7.92E-7 1.36E-8 6.69E-8 0.00E+0 1.42E-6 0.00E+0 0.00E+0 4.61E-9 0.00E+0 4.04E-9 Components for re-use4 kg 0.00E+0 0.00E+0 0.00E+0 0.00E+0 0.00E+0 0.00E+0 0.00E+0 0.00E+0 0.00E+0 0.00E+0 0.00E+0 0.00E+0 0.00E+0 Materials for recycling kg 1.36E+1 0.00E+0 0.00E+0 0.00E+0 0.00E+0 5.34E+0 0.00E+0 8.24E+0 0.00E+0 0.00E+0 0.00E+0 0.00E+0 0.00E+0 Materials for energy recovery4 kg 0.00E+0 0.00E+0 0.00E+0 0.00E+0 0.00E+0 0.00E+0 0.00E+0 0.00E+0 0.00E+0 0.00E+0 0.00E+0 0.00E+0 0.00E+0 Exported energy4 MJ (LHV) 0.00E+0 0.00E+0 0.00E+0 0.00E+0 0.00E+0 0.00E+0 0.00E+0 0.00E+0 0.00E+0 0.00E+0 0.00E+0 0.00E+0 0.00E+0 Table 25: Waste and output flows inventory categories – 100 m2 of SBS-modified bitumen membrane – F/T INVENTORY CATEGORY UNIT TOTAL PRODUCTION STAGE CONSTRUCTION STAGE USE STAGE END-OF-LIFE STAGE A1-A3 A4-A5 B1-B7 C1-C4 A1 A2 A3 A4 A5 B1-B3 B4 B5-B7 C1 C2 C3 C4 Hazardous waste disposed1,2 kg 1.33E+0 0.00E+0 0.00E+0 1.44E-2 0.00E+0 5.70E-2 0.00E+0 7.06E-1 0.00E+0 0.00E+0 0.00E+0 0.00E+0 5.49E-1 Non-hazardous waste disposed1,2 kg 2.72E+3 0.00E+0 0.00E+0 3.69E+1 0.00E+0 6.60E+1 0.00E+0 1.67E+3 0.00E+0 0.00E+0 0.00E+0 0.00E+0 9.47E+2 Intermediate- and low-level radioactive waste2,3 m3 4.36E-6 8.78E-7 4.26E-8 3.88E-7 6.85E-8 2.97E-7 0.00E+0 2.65E-6 0.00E+0 0.00E+0 2.23E-8 0.00E+0 2.05E-8 High-level radioactive waste2,3 m3 1.44E-6 1.66E-7 8.01E-9 2.61E-7 1.30E-8 7.52E-8 0.00E+0 9.08E-7 0.00E+0 0.00E+0 4.34E-9 0.00E+0 3.76E-9 Components for re-use4 kg 0.00E+0 0.00E+0 0.00E+0 0.00E+0 0.00E+0 0.00E+0 0.00E+0 0.00E+0 0.00E+0 0.00E+0 0.00E+0 0.00E+0 0.00E+0 Materials for recycling kg 1.36E+1 0.00E+0 0.00E+0 0.00E+0 0.00E+0 5.35E+0 0.00E+0 8.25E+0 0.00E+0 0.00E+0 0.00E+0 0.00E+0 0.00E+0 Materials for energy recovery4 kg 0.00E+0 0.00E+0 0.00E+0 0.00E+0 0.00E+0 0.00E+0 0.00E+0 0.00E+0 0.00E+0 0.00E+0 0.00E+0 0.00E+0 0.00E+0 Exported energy4 MJ (LHV) 0.00E+0 0.00E+0 0.00E+0 0.00E+0 0.00E+0 0.00E+0 0.00E+0 0.00E+0 0.00E+0 0.00E+0 0.00E+0 0.00E+0 0.00E+0
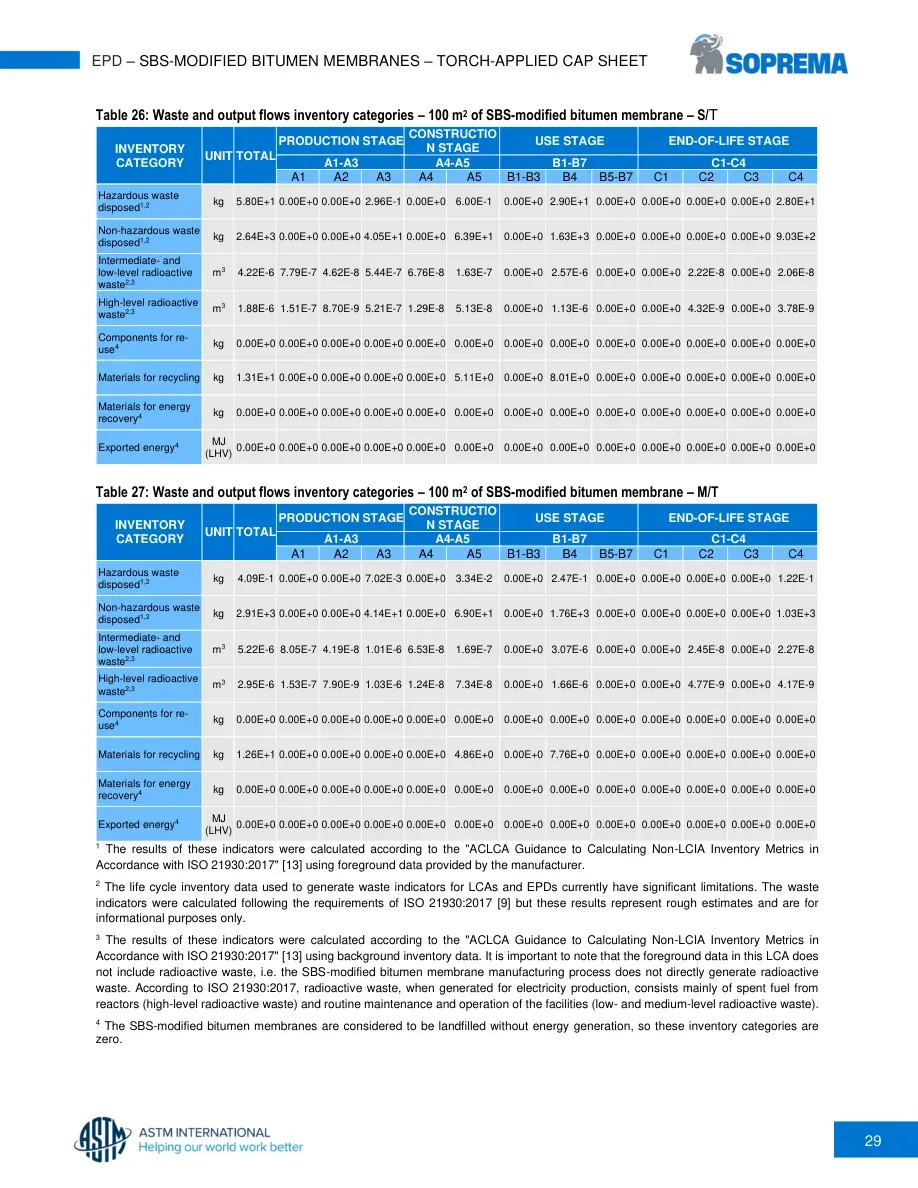
29 EPD – SBS-MODIFIED BITUMEN MEMBRANES – TORCH-APPLIED CAP SHEET Table 26: Waste and output flows inventory categories – 100 m2 of SBS-modified bitumen membrane – S/T INVENTORY CATEGORY UNIT TOTAL PRODUCTION STAGE CONSTRUCTION STAGE USE STAGE END-OF-LIFE STAGE A1-A3 A4-A5 B1-B7 C1-C4 A1 A2 A3 A4 A5 B1-B3 B4 B5-B7 C1 C2 C3 C4 Hazardous waste disposed1,2 kg 5.80E+1 0.00E+0 0.00E+0 2.96E-1 0.00E+0 6.00E-1 0.00E+0 2.90E+1 0.00E+0 0.00E+0 0.00E+0 0.00E+0 2.80E+1 Non-hazardous waste disposed1,2 kg 2.64E+3 0.00E+0 0.00E+0 4.05E+1 0.00E+0 6.39E+1 0.00E+0 1.63E+3 0.00E+0 0.00E+0 0.00E+0 0.00E+0 9.03E+2 Intermediate- and low-level radioactive waste2,3 m3 4.22E-6 7.79E-7 4.62E-8 5.44E-7 6.76E-8 1.63E-7 0.00E+0 2.57E-6 0.00E+0 0.00E+0 2.22E-8 0.00E+0 2.06E-8 High-level radioactive waste2,3 m3 1.88E-6 1.51E-7 8.70E-9 5.21E-7 1.29E-8 5.13E-8 0.00E+0 1.13E-6 0.00E+0 0.00E+0 4.32E-9 0.00E+0 3.78E-9 Components for re-use4 kg 0.00E+0 0.00E+0 0.00E+0 0.00E+0 0.00E+0 0.00E+0 0.00E+0 0.00E+0 0.00E+0 0.00E+0 0.00E+0 0.00E+0 0.00E+0 Materials for recycling kg 1.31E+1 0.00E+0 0.00E+0 0.00E+0 0.00E+0 5.11E+0 0.00E+0 8.01E+0 0.00E+0 0.00E+0 0.00E+0 0.00E+0 0.00E+0 Materials for energy recovery4 kg 0.00E+0 0.00E+0 0.00E+0 0.00E+0 0.00E+0 0.00E+0 0.00E+0 0.00E+0 0.00E+0 0.00E+0 0.00E+0 0.00E+0 0.00E+0 Exported energy4 MJ (LHV) 0.00E+0 0.00E+0 0.00E+0 0.00E+0 0.00E+0 0.00E+0 0.00E+0 0.00E+0 0.00E+0 0.00E+0 0.00E+0 0.00E+0 0.00E+0 Table 27: Waste and output flows inventory categories – 100 m2 of SBS-modified bitumen membrane – M/T INVENTORY CATEGORY UNIT TOTAL PRODUCTION STAGE CONSTRUCTION STAGE USE STAGE END-OF-LIFE STAGE A1-A3 A4-A5 B1-B7 C1-C4 A1 A2 A3 A4 A5 B1-B3 B4 B5-B7 C1 C2 C3 C4 Hazardous waste disposed1,2 kg 4.09E-1 0.00E+0 0.00E+0 7.02E-3 0.00E+0 3.34E-2 0.00E+0 2.47E-1 0.00E+0 0.00E+0 0.00E+0 0.00E+0 1.22E-1 Non-hazardous waste disposed1,2 kg 2.91E+3 0.00E+0 0.00E+0 4.14E+1 0.00E+0 6.90E+1 0.00E+0 1.76E+3 0.00E+0 0.00E+0 0.00E+0 0.00E+0 1.03E+3 Intermediate- and low-level radioactive waste2,3 m3 5.22E-6 8.05E-7 4.19E-8 1.01E-6 6.53E-8 1.69E-7 0.00E+0 3.07E-6 0.00E+0 0.00E+0 2.45E-8 0.00E+0 2.27E-8 High-level radioactive waste2,3 m3 2.95E-6 1.53E-7 7.90E-9 1.03E-6 1.24E-8 7.34E-8 0.00E+0 1.66E-6 0.00E+0 0.00E+0 4.77E-9 0.00E+0 4.17E-9 Components for re-use4 kg 0.00E+0 0.00E+0 0.00E+0 0.00E+0 0.00E+0 0.00E+0 0.00E+0 0.00E+0 0.00E+0 0.00E+0 0.00E+0 0.00E+0 0.00E+0 Materials for recycling kg 1.26E+1 0.00E+0 0.00E+0 0.00E+0 0.00E+0 4.86E+0 0.00E+0 7.76E+0 0.00E+0 0.00E+0 0.00E+0 0.00E+0 0.00E+0 Materials for energy recovery4 kg 0.00E+0 0.00E+0 0.00E+0 0.00E+0 0.00E+0 0.00E+0 0.00E+0 0.00E+0 0.00E+0 0.00E+0 0.00E+0 0.00E+0 0.00E+0 Exported energy4 MJ (LHV) 0.00E+0 0.00E+0 0.00E+0 0.00E+0 0.00E+0 0.00E+0 0.00E+0 0.00E+0 0.00E+0 0.00E+0 0.00E+0 0.00E+0 0.00E+0 1 The results of these indicators were calculated according to the "ACLCA Guidance to Calculating Non-LCIA Inventory Metrics in Accordance with ISO 21930:2017" [13] using foreground data provided by the manufacturer. 2 The life cycle inventory data used to generate waste indicators for LCAs and EPDs currently have significant limitations. The waste indicators were calculated following the requirements of ISO 21930:2017 [9] but these results represent rough estimates and are for informational purposes only. 3 The results of these indicators were calculated according to the "ACLCA Guidance to Calculating Non-LCIA Inventory Metrics in Accordance with ISO 21930:2017" [13] using background inventory data. It is important to note that the foreground data in this LCA does not include radioactive waste, i.e. the SBS-modified bitumen membrane manufacturing process does not directly generate radioactive waste. According to ISO 21930:2017, radioactive waste, when generated for electricity production, consists mainly of spent fuel from reactors (high-level radioactive waste) and routine maintenance and operation of the facilities (low- and medium-level radioactive waste). 4 The SBS-modified bitumen membranes are considered to be landfilled without energy generation, so these inventory categories are zero.
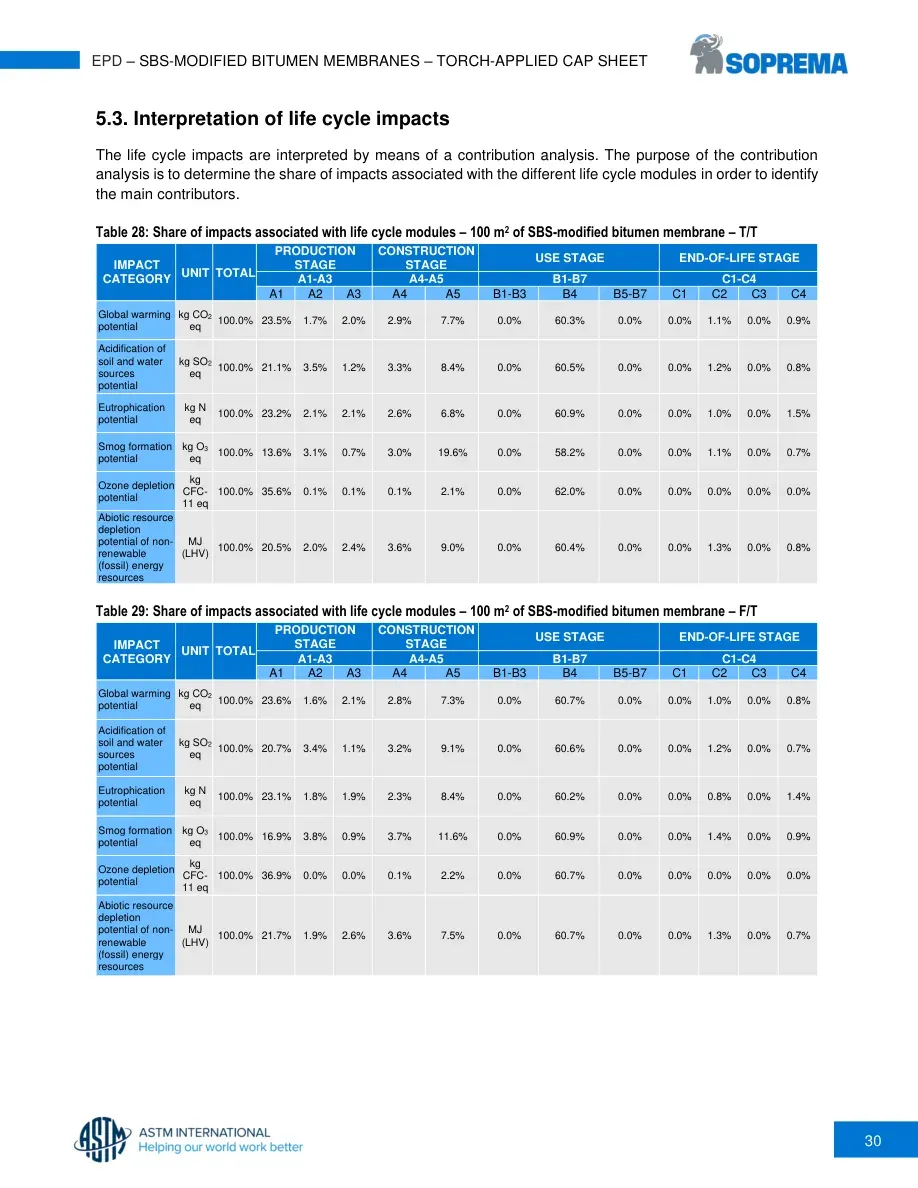
30 EPD – SBS-MODIFIED BITUMEN MEMBRANES – TORCH-APPLIED CAP SHEET 5.3. Interpretation of life cycle impacts The life cycle impacts are interpreted by means of a contribution analysis. The purpose of the contribution analysis is to determine the share of impacts associated with the different life cycle modules in order to identify the main contributors. Table 28: Share of impacts associated with life cycle modules – 100 m2 of SBS-modified bitumen membrane – T/T IMPACT CATEGORY UNIT TOTAL PRODUCTION STAGE CONSTRUCTION STAGE USE STAGE END-OF-LIFE STAGE A1-A3 A4-A5 B1-B7 C1-C4 A1 A2 A3 A4 A5 B1-B3 B4 B5-B7 C1 C2 C3 C4 Global warming potential kg CO2 eq 100.0% 23.5% 1.7% 2.0% 2.9% 7.7% 0.0% 60.3% 0.0% 0.0% 1.1% 0.0% 0.9% Acidification of soil and water sources potential kg SO2 eq 100.0% 21.1% 3.5% 1.2% 3.3% 8.4% 0.0% 60.5% 0.0% 0.0% 1.2% 0.0% 0.8% Eutrophication potential kg N eq 100.0% 23.2% 2.1% 2.1% 2.6% 6.8% 0.0% 60.9% 0.0% 0.0% 1.0% 0.0% 1.5% Smog formation potential kg O3 eq 100.0% 13.6% 3.1% 0.7% 3.0% 19.6% 0.0% 58.2% 0.0% 0.0% 1.1% 0.0% 0.7% Ozone depletion potential kg CFC-11 eq 100.0% 35.6% 0.1% 0.1% 0.1% 2.1% 0.0% 62.0% 0.0% 0.0% 0.0% 0.0% 0.0% Abiotic resource depletion potential of non-renewable (fossil) energy resources MJ (LHV) 100.0% 20.5% 2.0% 2.4% 3.6% 9.0% 0.0% 60.4% 0.0% 0.0% 1.3% 0.0% 0.8% Table 29: Share of impacts associated with life cycle modules – 100 m2 of SBS-modified bitumen membrane – F/T IMPACT CATEGORY UNIT TOTAL PRODUCTION STAGE CONSTRUCTION STAGE USE STAGE END-OF-LIFE STAGE A1-A3 A4-A5 B1-B7 C1-C4 A1 A2 A3 A4 A5 B1-B3 B4 B5-B7 C1 C2 C3 C4 Global warming potential kg CO2 eq 100.0% 23.6% 1.6% 2.1% 2.8% 7.3% 0.0% 60.7% 0.0% 0.0% 1.0% 0.0% 0.8% Acidification of soil and water sources potential kg SO2 eq 100.0% 20.7% 3.4% 1.1% 3.2% 9.1% 0.0% 60.6% 0.0% 0.0% 1.2% 0.0% 0.7% Eutrophication potential kg N eq 100.0% 23.1% 1.8% 1.9% 2.3% 8.4% 0.0% 60.2% 0.0% 0.0% 0.8% 0.0% 1.4% Smog formation potential kg O3 eq 100.0% 16.9% 3.8% 0.9% 3.7% 11.6% 0.0% 60.9% 0.0% 0.0% 1.4% 0.0% 0.9% Ozone depletion potential kg CFC-11 eq 100.0% 36.9% 0.0% 0.0% 0.1% 2.2% 0.0% 60.7% 0.0% 0.0% 0.0% 0.0% 0.0% Abiotic resource depletion potential of non-renewable (fossil) energy resources MJ (LHV) 100.0% 21.7% 1.9% 2.6% 3.6% 7.5% 0.0% 60.7% 0.0% 0.0% 1.3% 0.0% 0.7%

31 EPD – SBS-MODIFIED BITUMEN MEMBRANES – TORCH-APPLIED CAP SHEET Table 30: Share of impacts associated with life cycle modules – 100 m2 of SBS-modified bitumen membrane – S/T IMPACT CATEGORY UNIT TOTAL PRODUCTION STAGE CONSTRUCTION STAGE USE STAGE END-OF-LIFE STAGE A1-A3 A4-A5 B1-B7 C1-C4 A1 A2 A3 A4 A5 B1-B3 B4 B5-B7 C1 C2 C3 C4 Global warming potential kg CO2 eq 100.0% 24.3% 1.7% 1.9% 2.7% 6.9% 0.0% 60.6% 0.0% 0.0% 1.0% 0.0% 0.9% Acidification of soil and water sources potential kg SO2 eq 100.0% 21.8% 3.6% 1.0% 3.1% 8.2% 0.0% 60.5% 0.0% 0.0% 1.1% 0.0% 0.7% Eutrophication potential kg N eq 100.0% 22.4% 2.1% 1.9% 2.4% 8.0% 0.0% 60.9% 0.0% 0.0% 0.9% 0.0% 1.4% Smog formation potential kg O3 eq 100.0% 16.6% 3.8% 0.7% 3.3% 13.6% 0.0% 59.9% 0.0% 0.0% 1.2% 0.0% 0.8% Ozone depletion potential kg CFC-11 eq 100.0% 34.0% 0.1% 0.1% 0.1% 2.0% 0.0% 63.7% 0.0% 0.0% 0.0% 0.0% 0.0% Abiotic resource depletion potential of non-renewable (fossil) energy resources MJ (LHV) 100.0% 21.6% 2.0% 2.4% 3.5% 8.0% 0.0% 60.6% 0.0% 0.0% 1.2% 0.0% 0.7% Table 31: Share of impacts associated with life cycle modules – 100 m2 of SBS-modified bitumen membrane – M/T IMPACT CATEGORY UNIT TOTAL PRODUCTION STAGE CONSTRUCTION STAGE USE STAGE END-OF-LIFE STAGE A1-A3 A4-A5 B1-B7 C1-C4 A1 A2 A3 A4 A5 B1-B3 B4 B5-B7 C1 C2 C3 C4 Global warming potential kg CO2 eq 100.0% 21.7% 1.6% 2.1% 2.7% 9.2% 0.0% 60.7% 0.0% 0.0% 1.1% 0.0% 0.8% Acidification of soil and water sources potential kg SO2 eq 100.0% 19.6% 3.3% 1.2% 3.1% 9.9% 0.0% 60.8% 0.0% 0.0% 1.3% 0.0% 0.8% Eutrophication potential kg N eq 100.0% 22.4% 1.9% 2.0% 2.4% 7.9% 0.0% 60.9% 0.0% 0.0% 1.0% 0.0% 1.5% Smog formation potential kg O3 eq 100.0% 15.6% 3.6% 0.9% 3.5% 13.2% 0.0% 60.8% 0.0% 0.0% 1.5% 0.0% 0.9% Ozone depletion potential kg CFC-11 eq 100.0% 36.1% 0.0% 0.1% 0.1% 2.1% 0.0% 61.6% 0.0% 0.0% 0.0% 0.0% 0.0% Abiotic resource depletion potential of non-renewable (fossil) energy resources MJ (LHV) 100.0% 20.1% 2.0% 2.6% 3.5% 8.8% 0.0% 60.9% 0.0% 0.0% 1.4% 0.0% 0.8% The environmental impacts of the four types of membranes under study are dominated by the life cycle module B - Use, representing between 58.2% and 63.7% of the total impacts for all categories. This module represents the highest contributor because it includes the membrane resurfacing at 25 years (production, transport and installation of a new cap sheet) and membrane replacement at 50 years (end of life of the base and cap sheets plus the resurfacing cap sheet and production, transport and installation of a new base and cap sheets). Indeed, these processes together represent approximately 1.5 times the impacts of the rest of the life cycle (A1-A5 + C2-C4), as they involve the production, transport, installation and end of life of one base sheet and two cap sheets. Module A1 - Production of raw materials is the second highest contributor (between 13.6% and 36.9% of the total impacts for all categories).
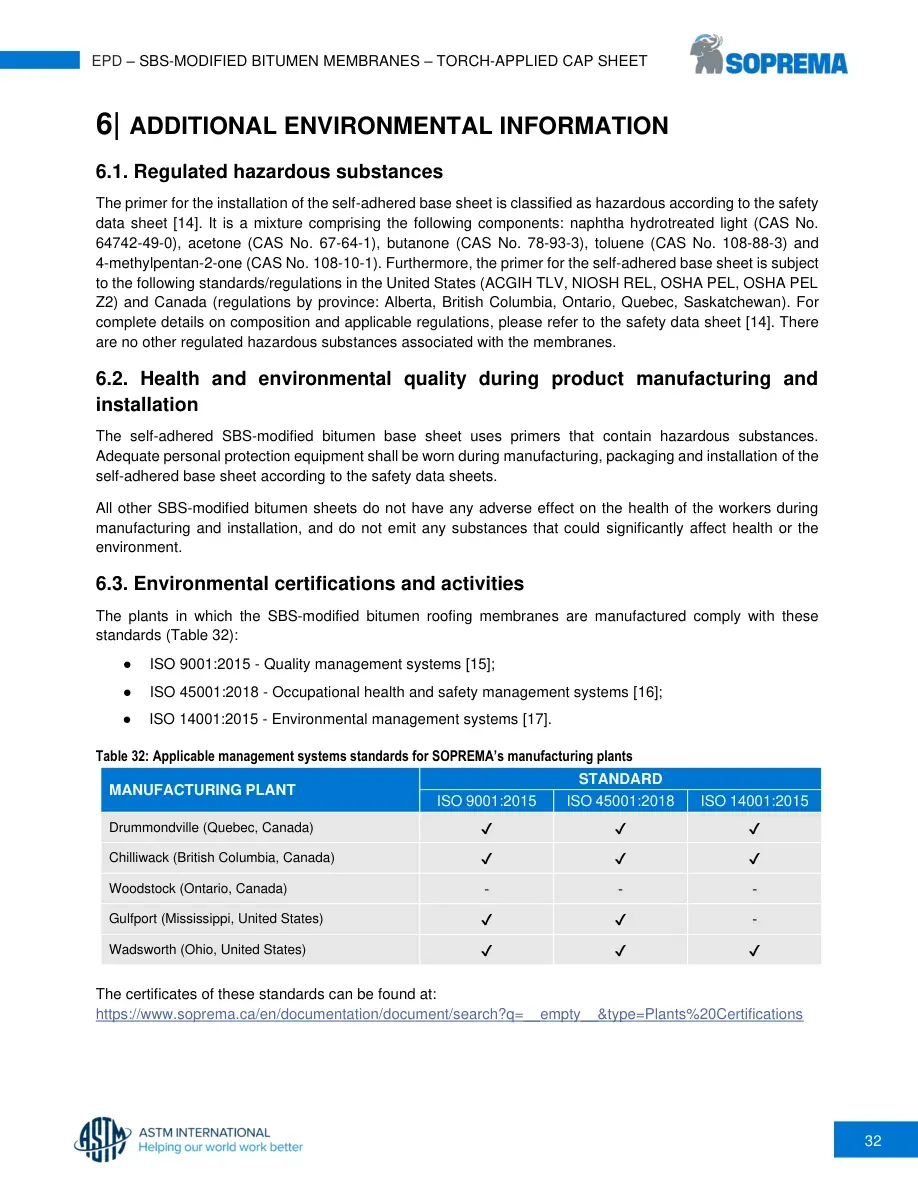
32 EPD – SBS-MODIFIED BITUMEN MEMBRANES – TORCH-APPLIED CAP SHEET 6| ADDITIONAL ENVIRONMENTAL INFORMATION 6.1. Regulated hazardous substances The primer for the installation of the self-adhered base sheet is classified as hazardous according to the safety data sheet [14]. It is a mixture comprising the following components: naphtha hydrotreated light (CAS No. 64742-49-0), acetone (CAS No. 67-64-1), butanone (CAS No. 78-93-3), toluene (CAS No. 108-88-3) and 4-methylpentan-2-one (CAS No. 108-10-1). Furthermore, the primer for the self-adhered base sheet is subject to the following standards/regulations in the United States (ACGIH TLV, NIOSH REL, OSHA PEL, OSHA PEL Z2) and Canada (regulations by province: Alberta, British Columbia, Ontario, Quebec, Saskatchewan). For complete details on composition and applicable regulations, please refer to the safety data sheet [14]. There are no other regulated hazardous substances associated with the membranes. 6.2. Health and environmental quality during product manufacturing and installation The self-adhered SBS-modified bitumen base sheet uses primers that contain hazardous substances. Adequate personal protection equipment shall be worn during manufacturing, packaging and installation of the self-adhered base sheet according to the safety data sheets. All other SBS-modified bitumen sheets do not have any adverse effect on the health of the workers during manufacturing and installation, and do not emit any substances that could significantly affect health or the environment. 6.3. Environmental certifications and activities The plants in which the SBS-modified bitumen roofing membranes are manufactured comply with these standards (Table 32): ● ISO 9001:2015 - Quality management systems [15]; ● ISO 45001:2018 - Occupational health and safety management systems [16]; ● ISO 14001:2015 - Environmental management systems [17]. Table 32: Applicable management systems standards for SOPREMA’s manufacturing plants The certificates of these standards can be found at: https://www.soprema.ca/en/documentation/document/search?q=__empty__&type=Plants%20Certifications MANUFACTURING PLANT STANDARD ISO 9001:2015 ISO 45001:2018 ISO 14001:2015 Drummondville (Quebec, Canada) ✔ ✔ ✔ Chilliwack (British Columbia, Canada) ✔ ✔ ✔ Woodstock (Ontario, Canada) - - - Gulfport (Mississippi, United States) ✔ ✔ - Wadsworth (Ohio, United States) ✔ ✔ ✔
33 EPD – SBS-MODIFIED BITUMEN MEMBRANES – TORCH-APPLIED CAP SHEET 6.4. Delayed emissions and unexpected adverse events No delayed emissions are expected from the SBS-modified bitumen roofing membranes. There are no unexpected adverse effects from the combustion, water damage or mechanical alteration of the product. 6.5. Sustainable roofing Some stakeholders of the building industry have promoted sustainable roofing by focusing on green roofs and reflective roofs only. Roof design for sustainability entails more than membrane selection. It means incorporating materials and details that extend the service life of the roof system beyond its currently accepted service life expectancy and provide future rehabilitation options to minimize consumption of new resources and delay demolition. Design for sustainable recovery from premature failure must be part of the original concept. It has to be realistically expected that a portion of a roof will eventually fail at some point for some reason. Sustainable recovery minimizes damage impact, reduces material waste and consumption of new materials. It also facilitates repair and renews roof performance. SBS-modified bitumen membranes allow for resurfacing and replacement at the end of their service life. Once the waterproof integrity of the membrane in place has been verified, or minor repairs to it have been performed if needed, the addition of an SBS-modified cap sheet to the system can be done easily. That is not to say that “cool roof” principles should be overlooked. Mitigation of urban heat islands should guide the design and specification of roof assemblies, as should energy conservation, durability, resiliency, raw materials consumption and waste reduction. There are reflective roof options available for virtually any roof and any building. Because of their longevity, SBS-modified bitumen membranes provide excellent value for building owners. They provide options for varying levels of reflectivity and have proven to retain high reflectivity levels over their service life (according to the Cool Roof Rating Council, www.coolroofs.org). 6.6. Further information Additional information can be found at: www.soprema.ca/en
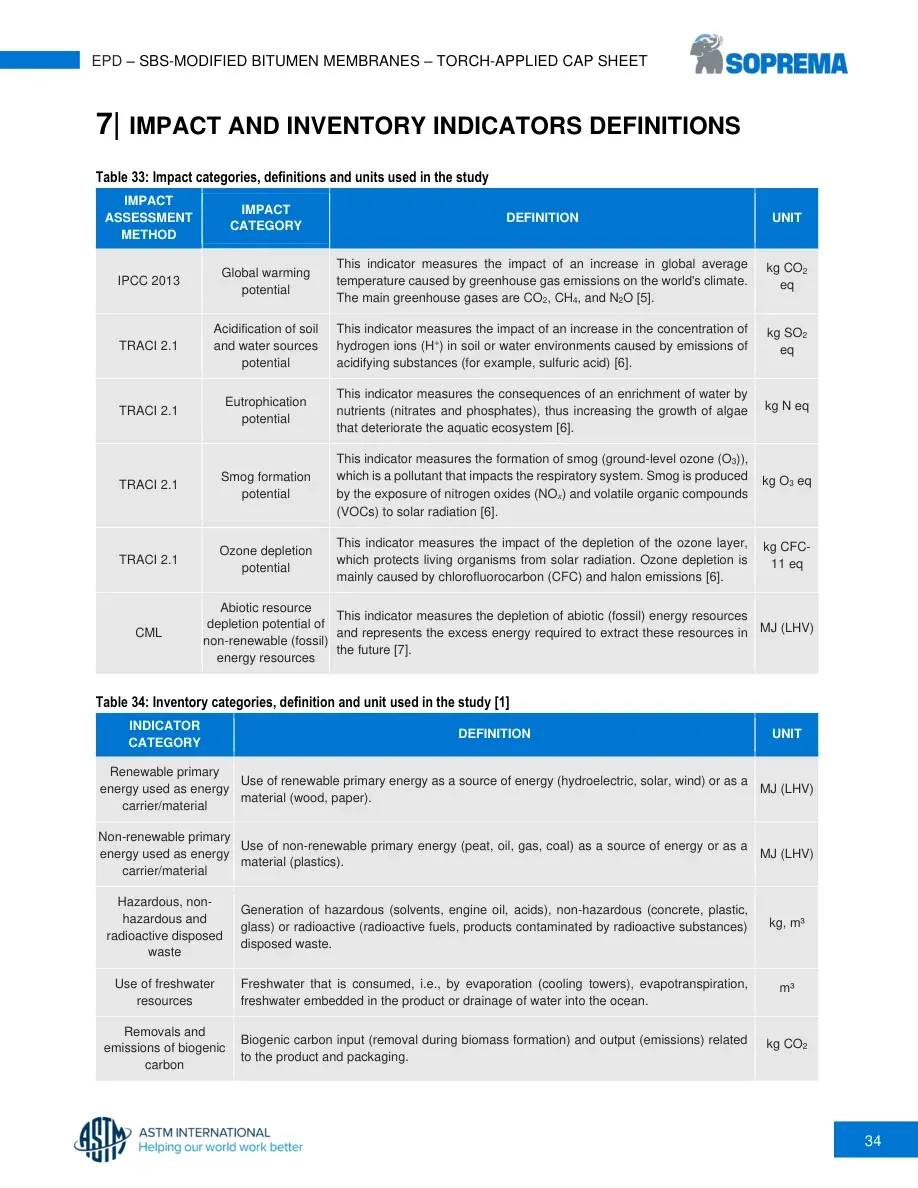
34 EPD – SBS-MODIFIED BITUMEN MEMBRANES – TORCH-APPLIED CAP SHEET 7| IMPACT AND INVENTORY INDICATORS DEFINITIONS Table 33: Impact categories, definitions and units used in the study IMPACT ASSESSMENT METHOD IMPACT CATEGORY DEFINITION UNIT IPCC 2013 Global warming potential This indicator measures the impact of an increase in global average temperature caused by greenhouse gas emissions on the world's climate. The main greenhouse gases are CO2, CH4, and N2O [5]. kg CO2 eq TRACI 2.1 Acidification of soil and water sources potential This indicator measures the impact of an increase in the concentration of hydrogen ions (H+) in soil or water environments caused by emissions of acidifying substances (for example, sulfuric acid) [6]. kg SO2 eq TRACI 2.1 Eutrophication potential This indicator measures the consequences of an enrichment of water by nutrients (nitrates and phosphates), thus increasing the growth of algae that deteriorate the aquatic ecosystem [6]. kg N eq TRACI 2.1 Smog formation potential This indicator measures the formation of smog (ground-level ozone (O3)), which is a pollutant that impacts the respiratory system. Smog is produced by the exposure of nitrogen oxides (NOx) and volatile organic compounds (VOCs) to solar radiation [6]. kg O3 eq TRACI 2.1 Ozone depletion potential This indicator measures the impact of the depletion of the ozone layer, which protects living organisms from solar radiation. Ozone depletion is mainly caused by chlorofluorocarbon (CFC) and halon emissions [6]. kg CFC-11 eq CML Abiotic resource depletion potential of non-renewable (fossil) energy resources This indicator measures the depletion of abiotic (fossil) energy resources and represents the excess energy required to extract these resources in the future [7]. MJ (LHV) Table 34: Inventory categories, definition and unit used in the study [1] INDICATOR CATEGORY DEFINITION UNIT Renewable primary energy used as energy carrier/material Use of renewable primary energy as a source of energy (hydroelectric, solar, wind) or as a material (wood, paper). MJ (LHV) Non-renewable primary energy used as energy carrier/material Use of non-renewable primary energy (peat, oil, gas, coal) as a source of energy or as a material (plastics). MJ (LHV) Hazardous, non-hazardous and radioactive disposed waste Generation of hazardous (solvents, engine oil, acids), non-hazardous (concrete, plastic, glass) or radioactive (radioactive fuels, products contaminated by radioactive substances) disposed waste. kg, m³ Use of freshwater resources Freshwater that is consumed, i.e., by evaporation (cooling towers), evapotranspiration, freshwater embedded in the product or drainage of water into the ocean. m³ Removals and emissions of biogenic carbon Biogenic carbon input (removal during biomass formation) and output (emissions) related to the product and packaging. kg CO2
35 EPD – SBS-MODIFIED BITUMEN MEMBRANES – TORCH-APPLIED CAP SHEET 8| ABBREVIATIONS, ACRONYMS AND CHEMICAL FORMULAE CFC Chlorofluorocarbon CFC-11 Trichlorofluoromethane CH4 Methane CO2 Carbon dioxide EPD Environmental product declaration eq Equivalent LCA Life cycle assessment LHV Lower heating value N Nitrogen NOx Nitrogen oxides O3 Ozone PCR Product category rules SO2 Sulphur dioxide VOCs Volatile organic compounds 9| GLOSSARY • Cut-off threshold. Criteria for excluding inputs and outputs based on their contribution (%) to the total mass and energy. If this contribution is lower than a certain threshold (cut-off), these flows can be ignored [9]. • Ecoinvent. Life cycle inventory database for materials, chemicals, power generation systems, transport and waste treatment processes [4]. • Environmental impact. Any negative or beneficial modification of the environment, resulting wholly or in part from environmental aspects [18] that is to say elements of the activities, products or services of an organization that can interact with the environment [19]. • Environmental product declaration (EPD). Environmental declaration providing quantified environmental data for a product using predetermined parameters based on the ISO 14040:2006 and ISO 14044:2006 standards related to life cycle assessment [19,20] as well as the ISO 14025:2006 standard related to type III environmental declarations [8]. • Functional unit (FU). Quantified performance of a product system intended to be used as a reference unit in a life cycle assessment [19]. • Life cycle assessment (LCA). Compilation and evaluation of the inputs and outputs (inventory) as well as the assessment of potential environmental impacts of a product during its life cycle [19]. • Product category rules (PCR). A set of specific rules, requirements and guidelines for the development of EPDs [9].
36 EPD – SBS-MODIFIED BITUMEN MEMBRANES – TORCH-APPLIED CAP SHEET 10| REFERENCES [1] UL Environment (2022) Product category rules for building-related products and services. Part A: Life cycle assessment calculation rules and report requirements. Standard UL 10010. Version 4.0. Available at: https://www.shopulstandards.com/ProductDetail.aspx?productId=ULE10010_6_S_20220328 [2] UL Environment (2021) Product category rules for building-related products and services. Part B: Asphalt shingles, built-up asphalt membrane roofing and modified bituminous membrane roofing EPD requirements. Standard UL 10010-11. Version 1.2. Available at: https://www.shopulstandards.com/ProductDetail.aspx?productId=ULE10010-11_3_S_20210524 [3] GreenDelta (2024) OpenLCA 2.0.2. Available at: https://www.openlca.org/ [4] Wernet, G., Bauer, C., Steubing, B., Reinhard, J., Moreno-Ruiz, E. and Weidema, B. (2016) The ecoinvent database version 3 (part I): overview and methodology. The International Journal of Life Cycle Assessment 21, 1218–1230. Available at: https://link.springer.com/article/10.1007/s11367-016-1087-8 [5] IPPC and WG2 (2013) IPCC Fifth Assessment Report (AR5). Climate Change 2014: Impacts, Adaptation, and Vulnerability [6] U.S. Environmental Protection Agency (2012) Tool for the reduction and assessment of chemical and other environmental impacts (TRACI) TRACI version 2.1 - User’s guide. Available at: https://nepis.epa.gov/Adobe/PDF/P100HN53.pdf [7] Hischier, R., Weidema, B., Althaus, H.-J., Bauer, C., Doka, G., Dones, R., Frischknecht, R., Hellweg, S., Humbert, S., Jungbluth, N., Köllner, T., Loerincik, Y., Margni, M. and Nemecek, T. (2010) Implementation of life cycle impact assessment methods data v2.2 (2010). ecoinvent Report No. 3 176. Available at: https://www.researchgate.net/publication/263239305_Implementation_of_Life_Cycle_Impact_Assessment_Methods_ecoinvent_report_No_3_v22 [8] International organization for standardization (2006) ISO 14025:2006 Environmental labels and declarations - Type III environmental declarations - Principles and procedures [9] International organization for standardization (2017) ISO 21930:2017 Sustainability in buildings and civil engineering works - core rules for environmental product declarations of construction products and services [10] Asphalt Institute (2019) Life cycle assessment of asphalt binder. Available at: https://www.asphaltinstitute.org/engineering/sustainability/life-cycle-assessment-of-asphalt-binder/ [11] Petro-Acc (2023) What is oxidized bitumen. Available at: https://www.petroacc.com/what-is-oxidized-bitumen [12] Vertima (Unknown year) Extract from the report : Life cycle assessment of SOPREMA’s air barriers [13] Flanagan, B. and Steckel, D. (2019) ACLCA guidance to calculating non-LCIA inventory metrics in accordance with ISO 21930:2017. Available at: https://aclca.org/wp-content/uploads/ISO-21930-Final.pdf [14] SOPREMA ELASTOCOL STICK safety data sheet. Available at: https://my.assets-library.com/m/3cebeac713cd703d/original/SDS-ELASTOCOL-STICK.pdf [15] International organization for standardization (2015) ISO 9001:2015 Quality management systems - requirements
37 EPD – SBS-MODIFIED BITUMEN MEMBRANES – TORCH-APPLIED CAP SHEET [16] International organization for standardization (2018) ISO 45001:2018 Occupational health and safety management systems - Requirements with guidance for use [17] International organization for standardization (2015) ISO 14001:2015 Environmental management systems - Requirements with guidance for use [18] International organization for standardization (2010) ISO 21931-1 Sustainability in building construction - framework for methods of assessment of the environmental performance of construction works - part 1: buildings [19] International organization for standardization (2006) ISO 14040:2006 Environmental management - Life cycle assessment - Principles and framework [20] International organization for standardization (2006) ISO 14044:2006 Environmental management - Life cycle assessment - Requirements and guidelines
38 EPD – SBS-MODIFIED BITUMEN MEMBRANES – TORCH-APPLIED CAP SHEET 1688 Jean-Berchmans-Michaud Street, Drummondville, Quebec, Canada J2C8E9 https://www.soprema.ca/en EPD FOR SBS-MODIFIED BITUMEN MEMBRANES – TORCH-APPLIED INSTALLATION
